
Fig. 5.
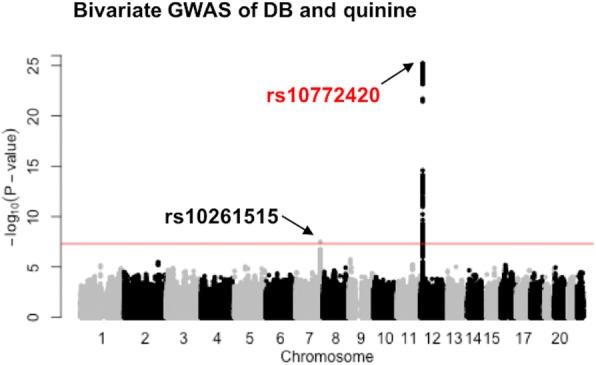
Bivariate GWAS showing a common variant on chromosome 7 associated with the perception of DB. The signal (rs10261515) on chromosome 7 is driven by DB (P = 2.5e-4 in the univariate analysis) not quinine (P = 0.15). The signal on chromosome 12 is mainly due to the association of rs10772420 with quinine rather than DB as shown in Fig. 2a and d. The red line indicates the genome-wide significance threshold of P = 5.0e-8