
Fig. 14.
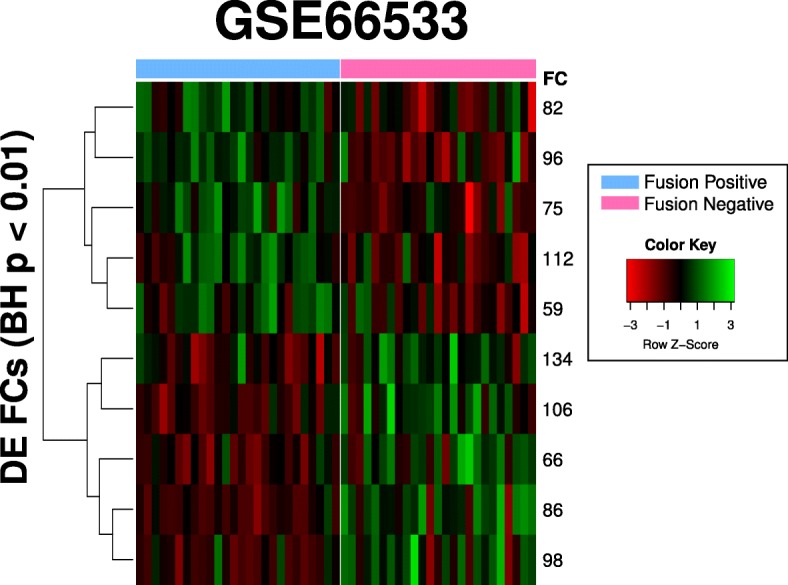
Heatmap of differentially expressed FCs in GSE66533. Ten DE FCs were identified. FC 82, 96 75, 112 and 59 generally had high scores in Fusion Negative samples compared to Fusion Positive samples, while the opposite is true for FCs 134, 106, 66, 86 and 98. The order of the samples in the heatmap can be found in Additional file 1: Text S1