
Fig. 9.
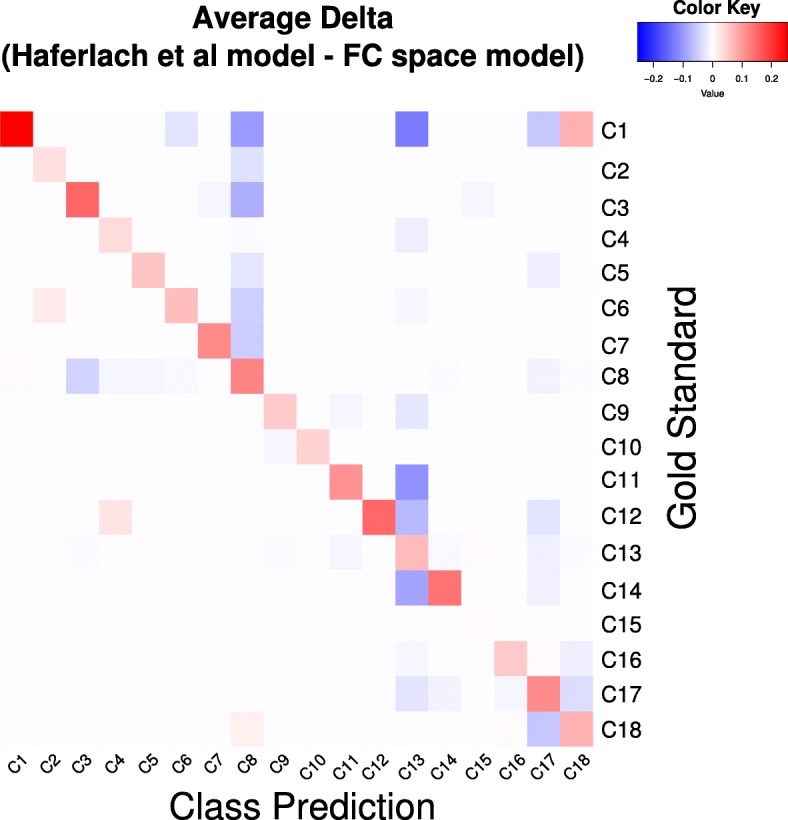
Differences between classification models (GSE12159). The average classification rate from both confusion matrices were normalized row-wise by the total number of samples in each gold standard class. The difference between the matrix from Haferlach et al. and our FC-based model was then computed and represented as a heatmap. Red squares represents higher values in the Haferlach et al. model; in off-diagonals squares, this indicates a higher misclassification by the Haferlach et al. model