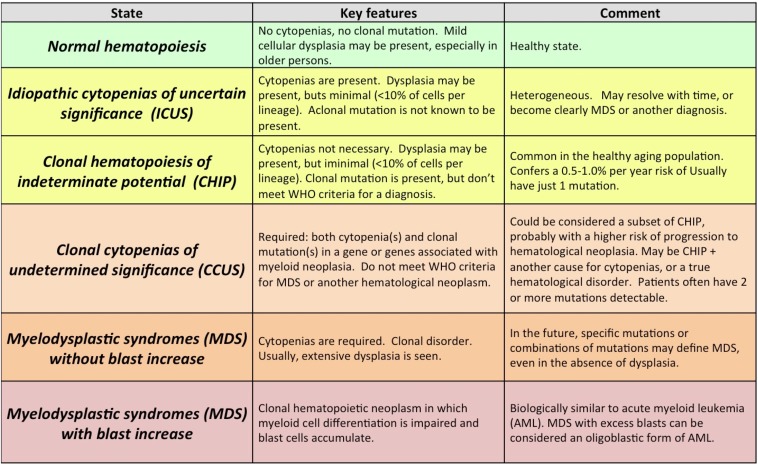
Table 2.
Definition of clonal and cytopenic states and their relationship to MDS
Color represents overall risk to the patient cohort: red and dark orange are higher risk, yellow is lower risk, and green is best. Reprinted from Steensma47 with permission.

