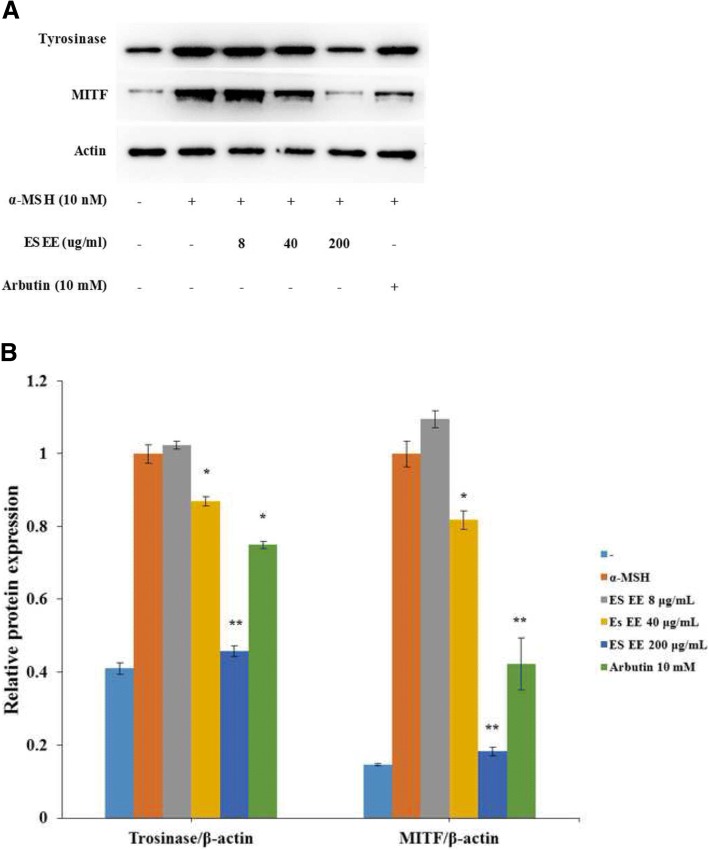
Fig. 4.
Effect of ES extract on melanogenesis-related proteins expression. a B16F10 cells were cultured with α-MSH (100 nM) for 24 h and then treated with various concentration of the ES extract (8, 40, 200 μg/ml) or arbutin (10 mM) for another 24 h. Then the content of cellular MITF, tyrosinase proteins were analyzed by western blotting assay. b Densitometry was normalized to the α-MSH group. Values are mean ± S.D. Data were analyzed by Student’s t-test. *: p < 0.05, **: p < 0.01 versus α-MSH treatment alone

