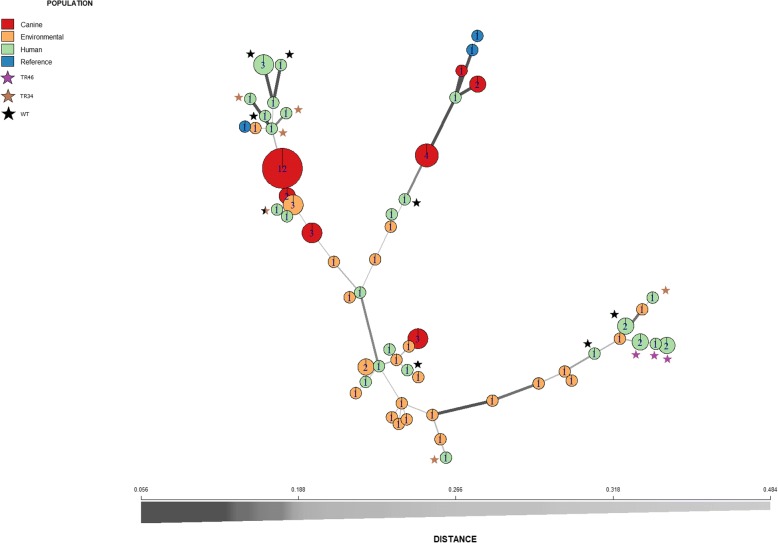
Fig. 1.
Minimum spanning tree of A. fumigatus isolates. Circles indicate different genotypes, numbers inside the circles indicate the number of isolates belonging to that particular genotype, thickness of the line indicates the relatedness of the connected isolates determined by Bruvo distance; values close to zero indicate identical isolates, while values close to 1 indicate unrelated isolates [35]. Additionally, TR mutations present in the isolates are depicted as color-coded stars. The black star (WT) refers to azole sensitive phenotype

