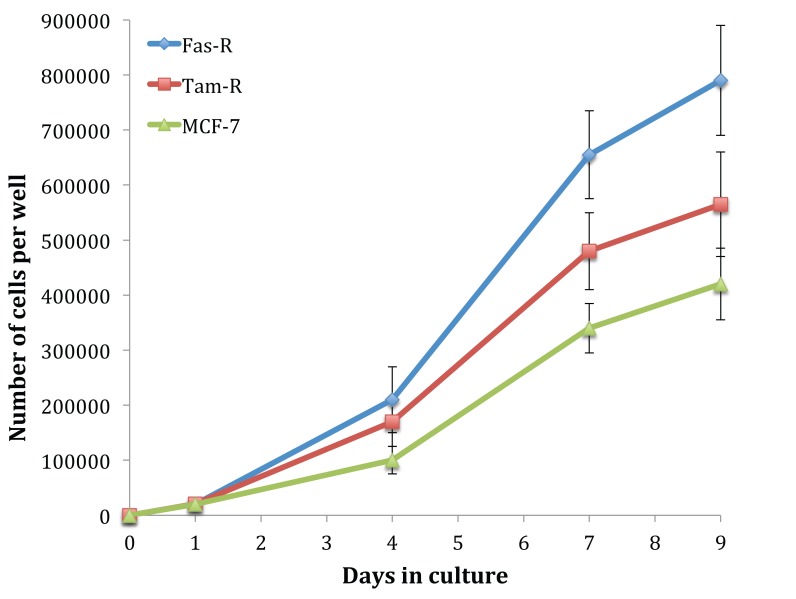
Fig. (1).
Growth curves showing the growth rates of MCF-7, TamR and FasR cells. Cells were seeded at a density of 1.5 million cells per plate on day 0. Cells were counted on days 1, 4, 7 and 9 and media was replenished on day 4. Cells were incubated at 37°C with 5% CO2. Cell counts represent the mean number per 3 counts (n=3 ± SD). FasR cells showed a significantly elevated growth rate compared to both TamR and MCF-7 cells (p 0.012 and 0.05 respectively). Passage numbers were 12, 14, 20 for MCF-7 cells; 22, 25, 30 for TamR cells; 31, 35 and 40 for FasR cells.

