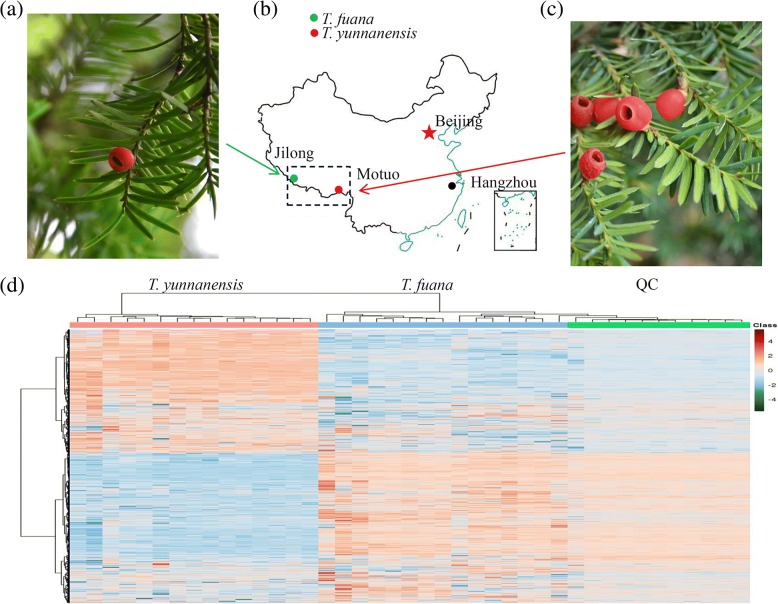
Fig. 1.
Untargeted metabolite profiling reveals the variations in the abundance of metabolites between T. yunnanensis and T. fuana. a A picture of the twigs of T. fuana. b The collection sites of T. fuana (Jilong) and T. yunnanensis (Motuo) were indicated by green and red small dots, respectively. c A picture of the twigs of T. yunnanensis. d A heatmap of the metabolites identified in the metabolomes of the two Taxus species (n = 15). The heatmap scale ranges from − 4 to + 4 on a log2 scale

