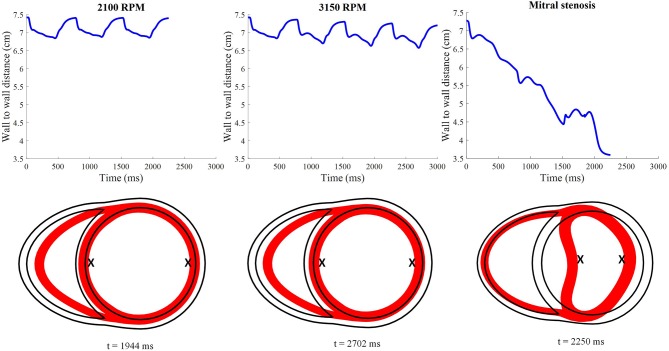
Figure 12.
Distance between the LV free wall endocardium and LV septal endocardium midway between the apex and the base. The lower 2D plots depict the cross-section of the ventricles taken at midlevel along the apicobasal direction for all LVAD simulation settings. The red surface indicates the myocardial cross-section at time of smallest LV whilst the black outline indicates the myocardial cross-section at time t = 0. “X”; denotes the two points used to calculate the wall to wall distance.

