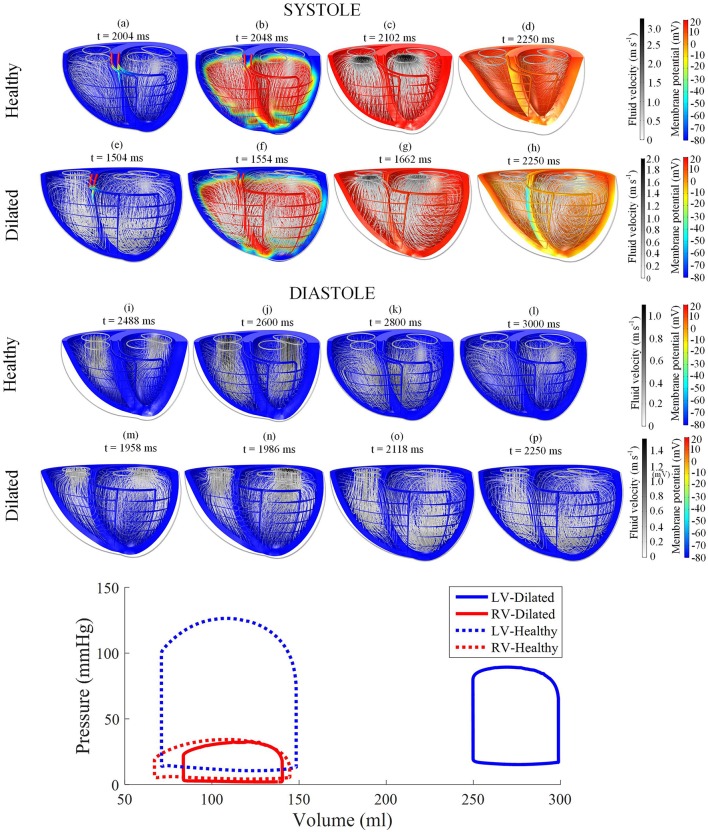
Figure 3.
Snapshots of the biventricular multiphysics model depicting the myocardial membrane potential, myocardial movement and fluid velocity streamlines taken at various time points during systole and diastole. (a–d,i–l) were taken from the healthy heart model. (e–h,m–p) were from the dilated heart model. The stimulus was applied at t = 2,002 ms for the healthy model and t = 1,502 ms for the dilated model. The pressure-volume relations are displayed at the bottom of the figure. Streamline tube radius is proportional to the blood velocity magnitude. The animations of healthy model and dilated heart model are available in Supplementary Animations 1, 2 respectively.

