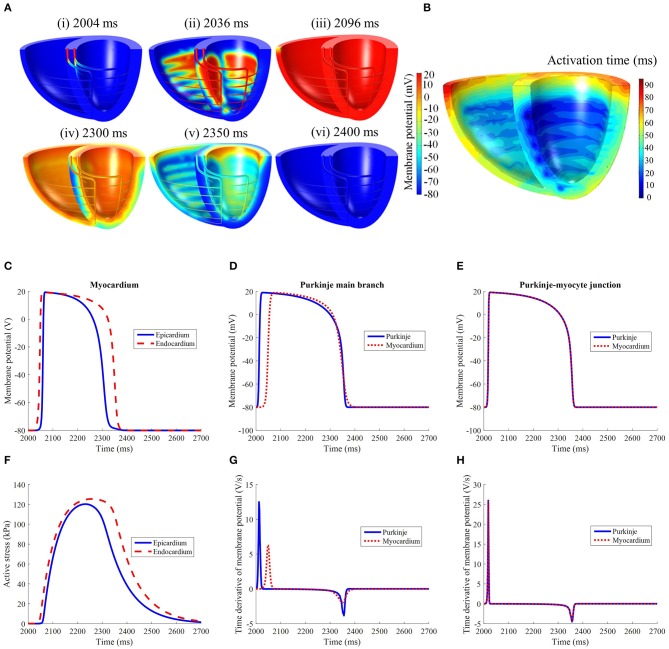
Figure 4.
(A) Electrical activation in the standard model following initiation at t = 2,002 ms. It should be noted that the recovery spreads in the opposite direction of activation. (B) Electrical activation time map in the standard model. Comparison of (C) LV free wall myocardium endocardial and epicardial, (D) Purkinje fiber, and (E) Purkinje-myocyte junction action potential profiles. (F) Active stress profile of the myocardium taken at the same location as (C). The time derivative of membrane potential of the (G) Purkinje fiber and (H) Purkinje-myocyte junction, taken at the same locations as in (D,E).

