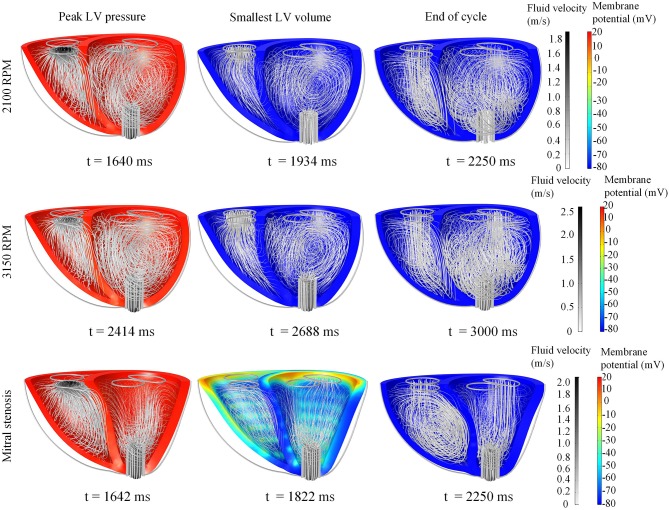
Figure 8.
Snapshots of the biventricular model with LVAD, depicting the membrane potential, myocardial movement and fluid velocity streamlines at the times of peak LV pressure, smallest LV volume, and end-diastole. The snapshots are taken at the third cycle of stable 2,100 RPM pump speed (Top), fourth cycle following speed increment to 3,150 RPM (Middle), and third cycle of mitral stenosis (Bottom). Streamline density is proportional to the blood velocity magnitude. The animations of these snapshots are available in Supplementary Animation 3 for the 2,100 RPM setting, Supplementary Animation 4 for speed increment setting and Supplementary Animation 5 for mitral stenosis case.

