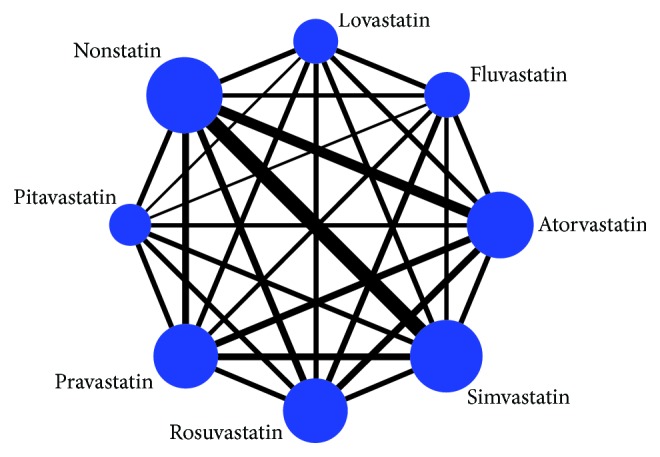
Figure 2.

Network of comparisons for the multiple-treatment meta-analysis for cancer occurrence in diabetic patients. The width of the solid lines presents proportional to the number of trials that compares each pairwise treatment, and the size of each node presents proportional to the number of participants.
