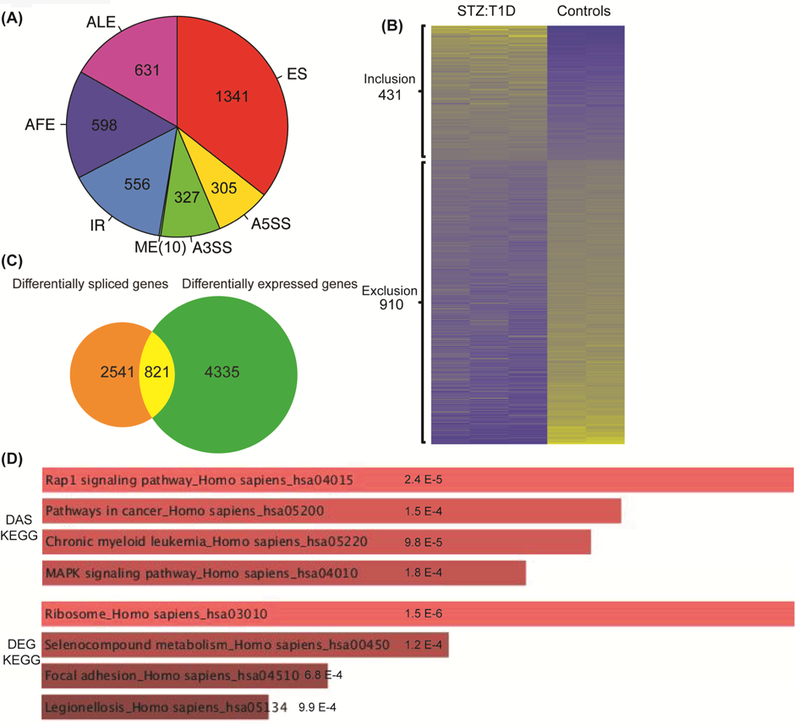
Figure 1: DAS and DEG analysis in T1D mouse hearts.

A) DAS analyses were performed using the RNA-seq data from STZ:T1D and mock treated, non-diabetic (Control) mouse hearts. AS changes in STZ:T1D mice were grouped into seven different categories based on the type of AS event: cassette Exon Splicing (ES), Alternative 5’ Splice Site (A5SS), Alternative 3’ Splice Site (A3SS), Mutually Exclusive exon (ME), Intron Retention (IR), Alternative First Exon (AFE) and Alternative Last Exon (ALE). The pie chart depicts the distribution of different splicing types identified in T1D hearts based on the criteria that |ΔΨ| > 0.05 and q < 0.05. The total DAS events was 3768. B) Heat map of alternative exons that are either included or excluded in T1D vs control mouse hearts based on percent spliced in (PSI) values. Yellow represents high PSI values and blue indicates low PSI values. C) Venn diagram comparison of DAS and DEG in STZ:T1D and control mouse hearts. 3362 DAS genes (some have multiple AS events) were compared to 5156 genes with a change in mRNA levels (>2 fold increase or decrease, and q < 0.05). D) The KEGG categories for DAS or DEG changes in T1D were identified using Enrichr (http://amp.pharm.mssm.edu/Enrichr). Significance is represented on the charts.
