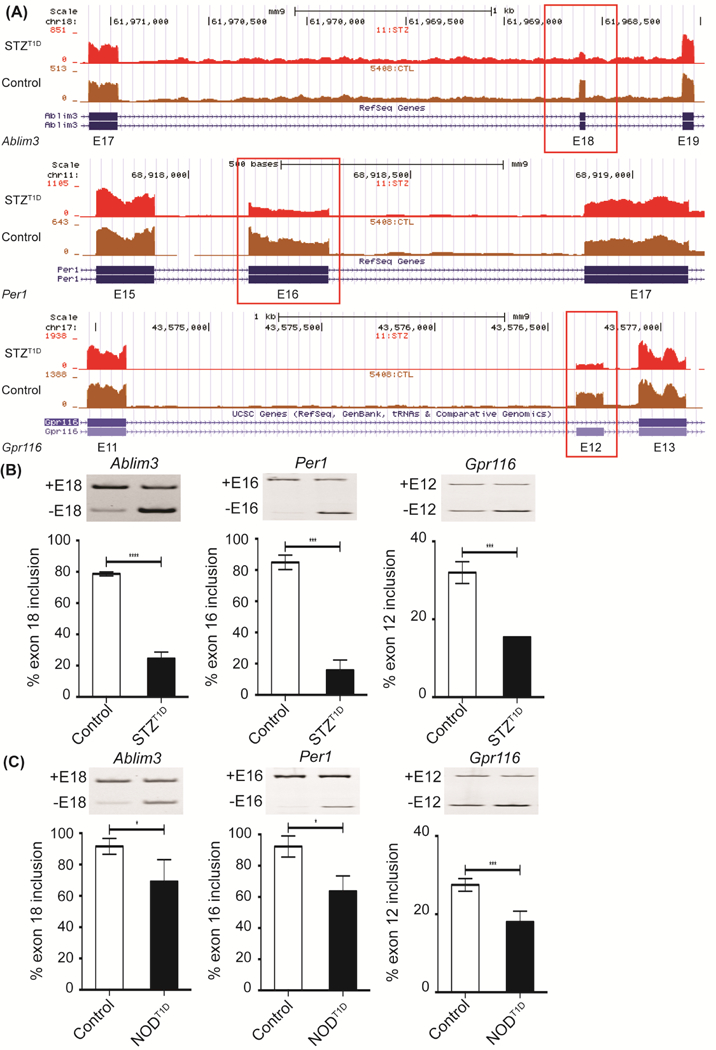
Figure 2: Validation of newly identified DAS events in two different T1D mouse models.

A) Representative genome browser images of AS of Ablim3 exon 18, Per1 exon 16, and Gpr116 exon 12 in mock treated, non-diabetic (Control) or STZ:T1D mice left ventricles based on RNA-Seq reads. % inclusion of Ablim3 exon 18, Per1 exon 16, and Gpr116 exon 12 was determined by qRT-PCR in B) Control or STZ:T1D (n≥3) and C) in non-diabetic (Control) or NOD:T1D mice left ventricles (n≥3). In AS gel figures +E# = Exon # inclusion and −E# = Exon # exclusion. Data represent means ± SD. P-values are represented as **** < 0.0001, *** < 0.001, * < 0.05.
