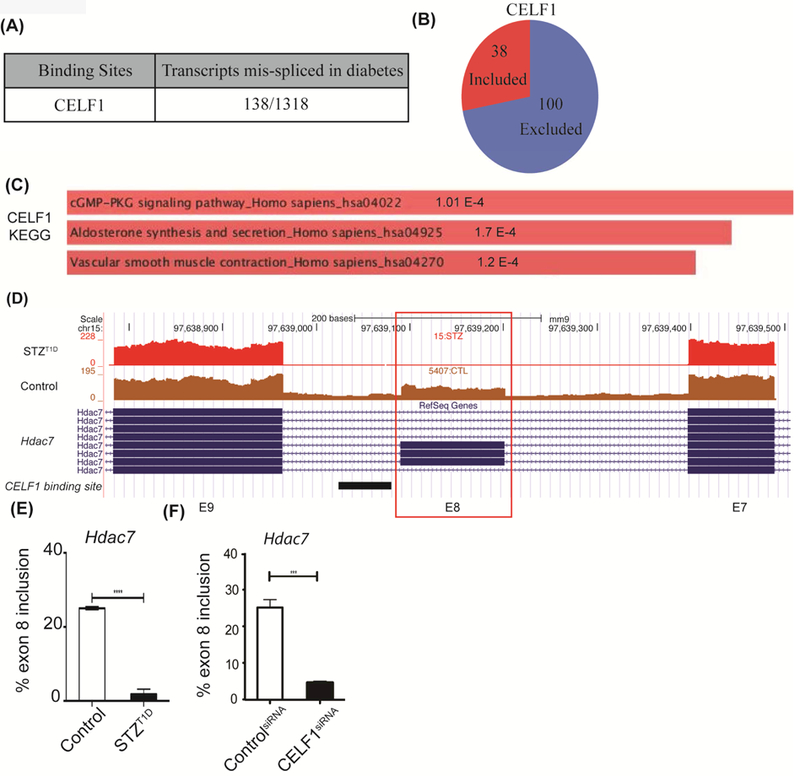
Figure 3: CELF1 binding sites are present within transcripts mis-spliced in T1D hearts.

A) Number of transcripts differentially spliced in T1D mouse hearts that display CELF1 binding sites. CELF1 binding sites were identified by extracting data from CELF1 CLIP-Seq and overlapping these binding sites within transcripts (1318) mis-spliced in T1D hearts. To evaluate the significance of events that are positively or negatively regulated in both datasets, Fisher’s exact test was used to examine the enrichment. The Pearson correlation coefficient for regulated AS changes was calculated as 0.74, higher than the correlation coefficient of non-regulated events. B) Distribution of cassette exon inclusion versus exclusion in CELF1 target transcripts differentially spliced in diabetes. C) The KEGG pathway categories for CELF1-regulated AS events in T1D hearts using Enrichr. D) Representative genome browser images of putative CELF1 target Hdac7 exon 8 in Control vs STZ:T1D mice left ventricles. CELF1 binding sites derived from CLIP-Seq data were represented below the genome browser image as a black rectangle. E) AS of Hdac7 exon 8 in Control (n=3) vs STZ:T1D mice left ventricles (n=2). F) AS analysis of endogenous Hdac7 exon 8 in H9c2 cell transfected with scrambled (Control) or CELF1-specific siRNA pools (n=3). Data represent means ± SD. P-values are represented as **** < 0.0001, *** < 0.001.
