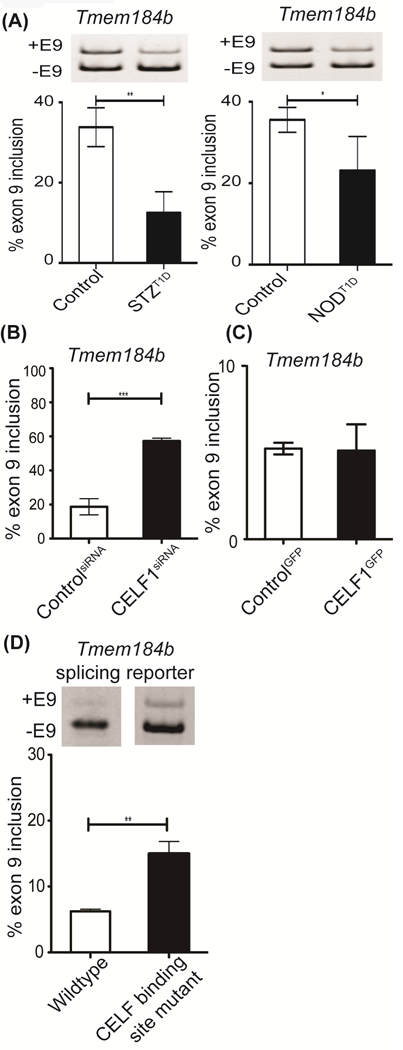
Figure 4: CELF1 contributes to diabetes-induced AS changes.

AS analysis of Tmem184b exon 9 A) in Control vs STZ:T1D (left graph) or Control vs NOD:T1D mice left ventricles (right graph) (n≥3), B) in H9c2 cell transfected with scrambled (Control) or CELF-specific siRNA pools (n=3), C) in H9c2 cells transfected with GFP (Control) or CELF1GFP (n=3), and D) in H9c2 cells transfected with wild-type or CELF1 binding site mutant Tmem184b splicing minigene reporter (n=4, two independent experiments). Data represent means ± SD. P-values are represented as *** < 0.001, ** < 0.01, * < 0.05.
