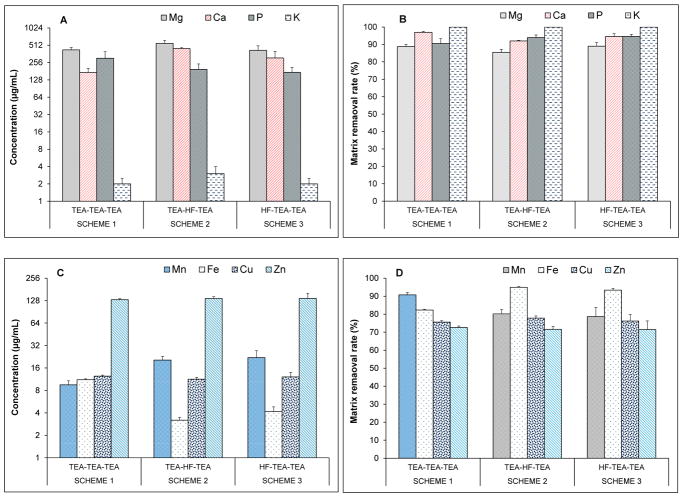
Fig. 2.
Performances of coprecipitation schemes on removal of major element matrix (A), and essential element matrix (C). Bars (A and C) show the concentration of matrix elements remained in MVM solution after third coprecipitation with each scheme. Bars (B and D) show percent removal of the matrix elements. Results are mean ± standard deviation for five replicates (n = 5).

