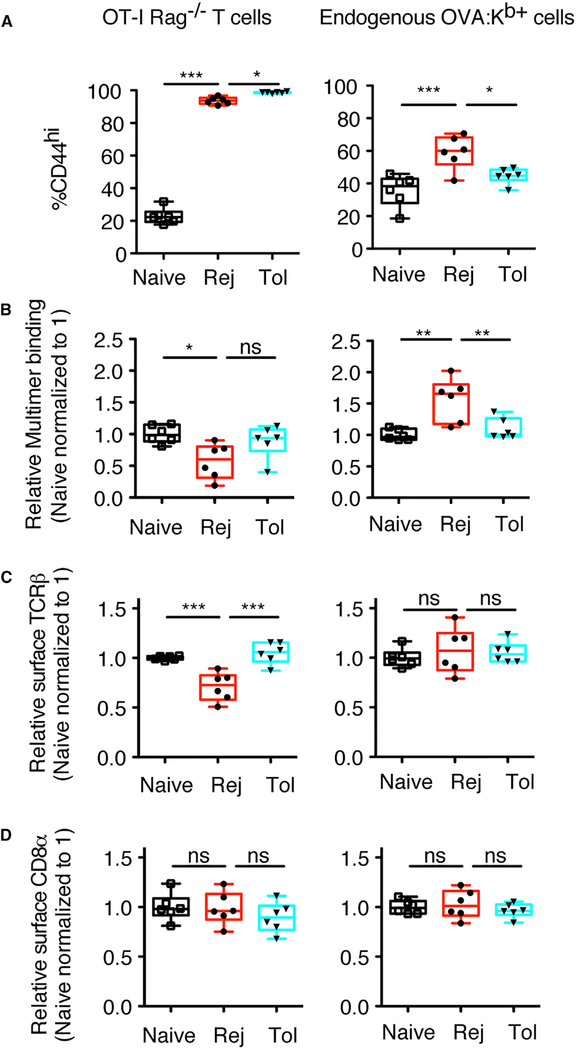
Figure 4. Differences in T Cell Avidity between Rejecting and Tolerant Mice Result from Population-Level Changes Post-Alloantigen Encounter and Are Not Observed with TCRTg OT-I T Cells.
1 × 10⁵ OT-I/RAG-KO T cells were adoptively transferred into lymphoreplete naive untransplanted mice, mice transplanted with a BALB/c-OVA heart and left untreated (Rej), or transplanted mice tolerized with anti-CD154 (Tol), and T cells were analyzed 7–8 days later. (A) Percentages of CD44hi OT-I/RAG-KO and endogenous OVA:Kb+ cells. (B–D) Normalized values of the geometric mean fluorescence intensity of multimer binding (B), surface TCRβ (C), and CD8α (D) for CD44hi OT-I/RAG-KO and endogenous OVA:Kb+ cells are shown. Values were normalized, with the average of the MFI for the naive mice in each experiment set to 1. Data are pooled from 2 independent experiments, with n = 6 mice total per group. Box-and-whisker plots with Tukey whiskers are superimposed with the individual data points. Data were analyzed by one-way ANOVA with Bonferroni correction for multiple testing. *p < 0.05, **p < 0.01, ***p < 0.001. NS, not significant.

