Figure 2.

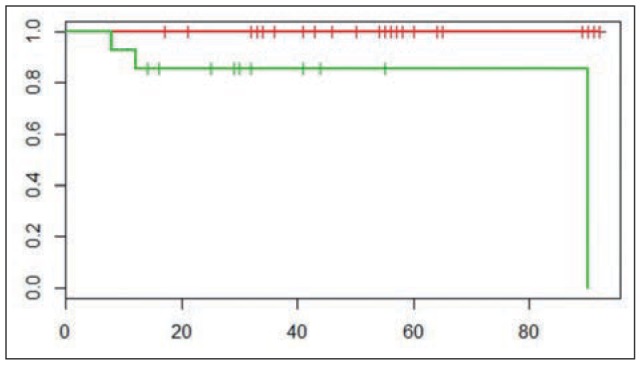
KaplaneMeier (Mantel-Cox test) plot of overall survival rate in the RRH and TLRH groups (log-rank test p=0. 00184; Chisq= 9.7 on 1 degrees of freedom). Red line: RRh; Green line: TLRH

KaplaneMeier (Mantel-Cox test) plot of overall survival rate in the RRH and TLRH groups (log-rank test p=0. 00184; Chisq= 9.7 on 1 degrees of freedom). Red line: RRh; Green line: TLRH