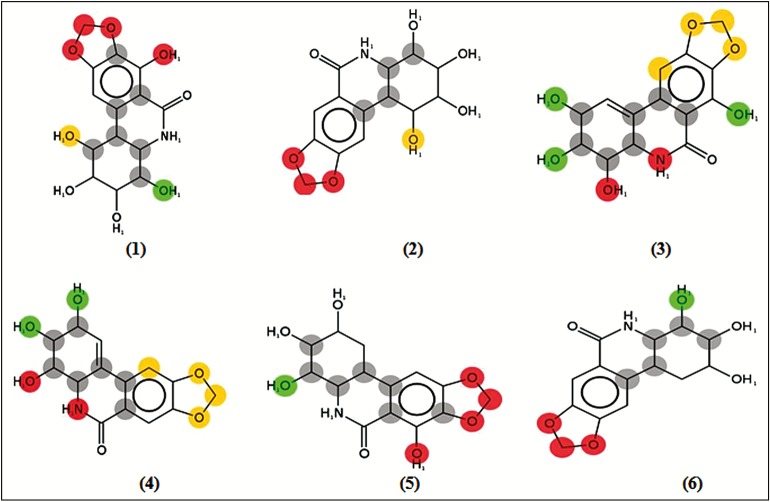
Figure 3.
Metabolic predictions using Metaprint2D for each lead. The color highlighting an atom indicates its normalized occurrence ratio (NOR). Atoms are colored according to the likelihood of a metabolic site; high: red, medium: orange, low: green, very low: not colored, and no data: gray. A high NOR indicates a more frequently reported site of metabolism in the metabolite database for Amaryllidaceae alkaloids (1–6)

