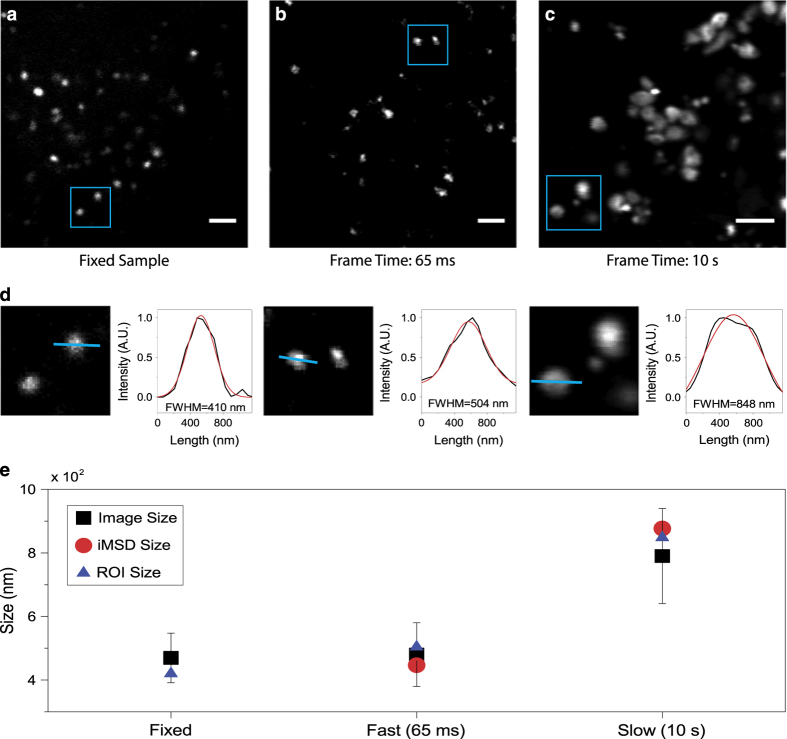
Figure 2. Setting the experimental parameters.
(a) Exemplary image of stained lysosomes in a fixed sample. Scale bar: 2 μm (b) First frame of a stack of images of stained lysosomes in a living cell, acquired with the appropriate parameters. Temporal resolution: 65 ms/frame. Scale bar: 2 μm (c) First frame of a stack of images of stained lysosomes in a living cell, acquired at low speed: artifactual deformation of the apparent lysosome size due to organell motion during imaging is clearly visible. Temporal resolution: 10 s/frame. Scale bar: 2 μm. (d) Example of size calculation for imaged lysosomes in blue ROI of (a), (b) and (c). The intensity profile along the blue line was fitted with a Gaussian function to retrieve the FWHM, i.e. an estimate of spot size. FWHM values are reported for each fitting. (e) Graphical representation of size values obtained by image analysis described in panel (d) for all imaged lysosomes (black square, mean value and standard deviation), for lysosomes enclosed within the blue ROI (blue triangle) and retrieved by iMSD analysis (red circle).

