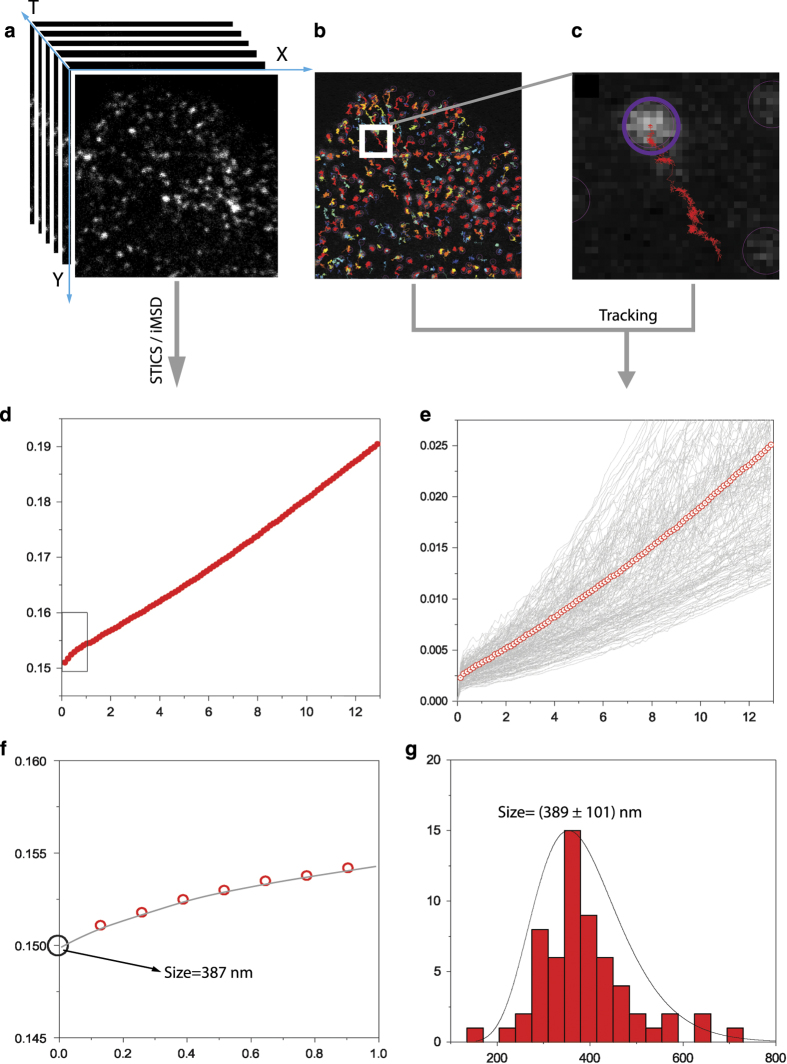
Figure 3. Structural and dynamic parameters derived by SPT and iMSD analyses.
(a) Stack of 1000 intensity images of fluorescently-labelled early endosomes acquired by time-lapse confocal imaging in a living cell at temporal resolution of 129 ms and pixel size of 69 nm. (b) Trackmate ImageJ plugin was used to extract trajectories from stack in (a). Retrieved trajectories are superimposed on the first frame of the stack. All the trajectories longer than ~12 s were used to calculate the standard MSD with custom MATLAB script. (c) Zoomed region from panel (b) in which a single trajectory is depicted. (d) iMSD curve obtained from the provided Matlab algorithm (e) All the calculated MSD traces (grey lines) with the average one in red (empty dots). (f) Zoomed region of iMSD (red empty dots) in (d) with relative fitting curve (grey). The square root of the y-axis intercept retrieved by fitting is used to estimate the average size (diameter) of imaged early endosomes. (g) Size (diameter) distribution of imaged organelles. Values were extracted from the first frame of the movie (a) by means of ImageJ plugin Analyze Particles. This latter allowed to isolate early endosomes fluorescence spots. Then spot diameters were derived from the calculated spot area.

