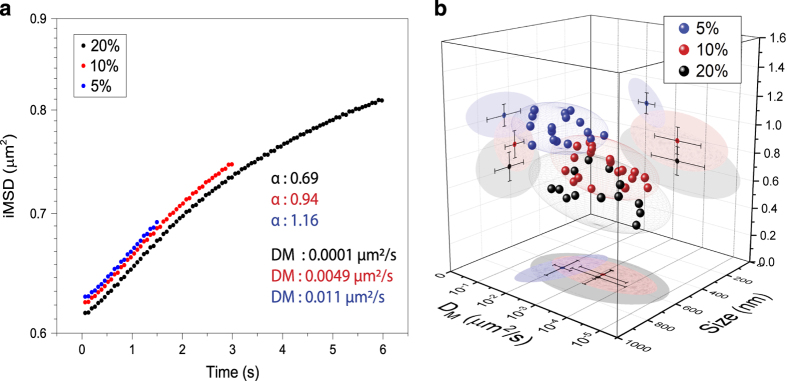
Figure 4. The effect of the experiment time window on iMSD analysis.
(a) Extending the time window of the analysis from 5% (blue curve) to 10% (red, optimal value, see text) and finally 20% (black) of the total duration of the acquired stack of images affects the obtained iMSD trace and the corresponding descriptive parameters (mainly α and DM in this example). (b) The three sets of data described in (a) are here represented in the 3D parametric space (α, size and DM) to build the corresponding structural/dynamic fingerprints at the population level.

