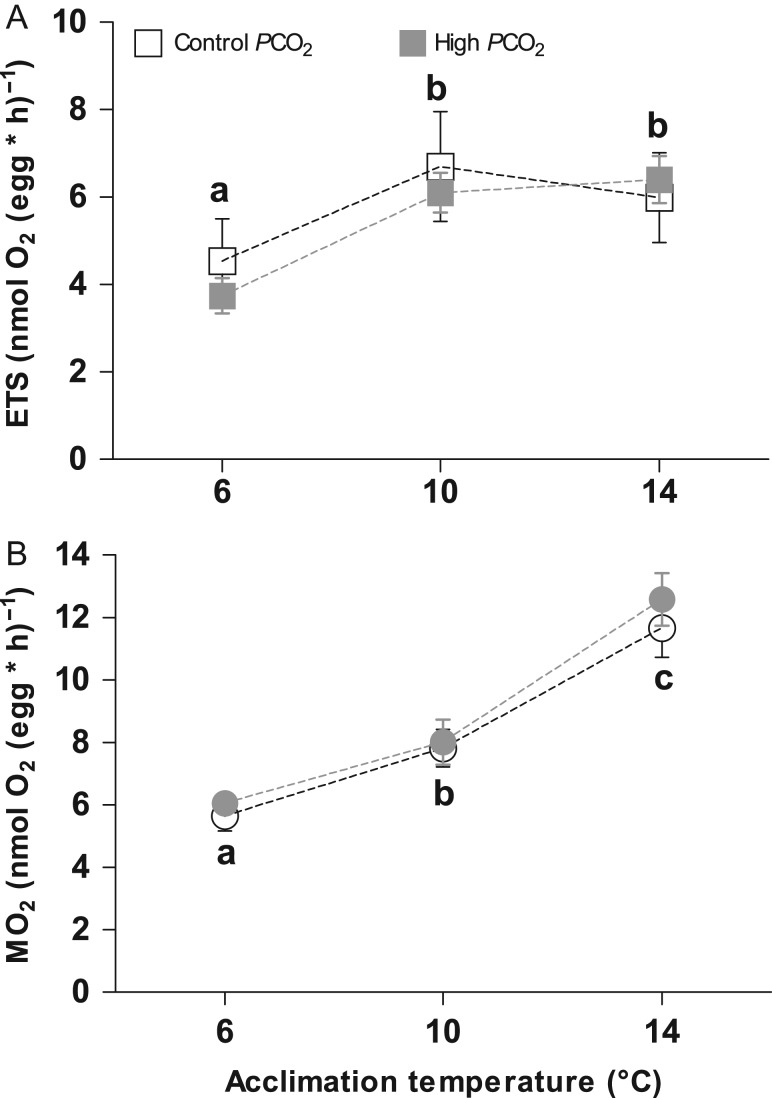
Figure 1:
Respiration performance and mitochondrial capacity of Atlantic herring (Clupea harengus) embryos at 50% eye pigmentation stage. Values are reported as mean ± SEM. Panel A: Electron Transport System (ETS) capacity. Open squares: control PCO2 (400 μatm), solid squares: high PCO2 (1100 μatm). Panel B: Whole-embryo respiration. Open circles: control PCO2 (400 μatm), solid circles: high PCO2 (1100 μatm). Different letters within panels indicate significant differences (P < 0.05) between temperature treatments independent of the CO2 treatment.

