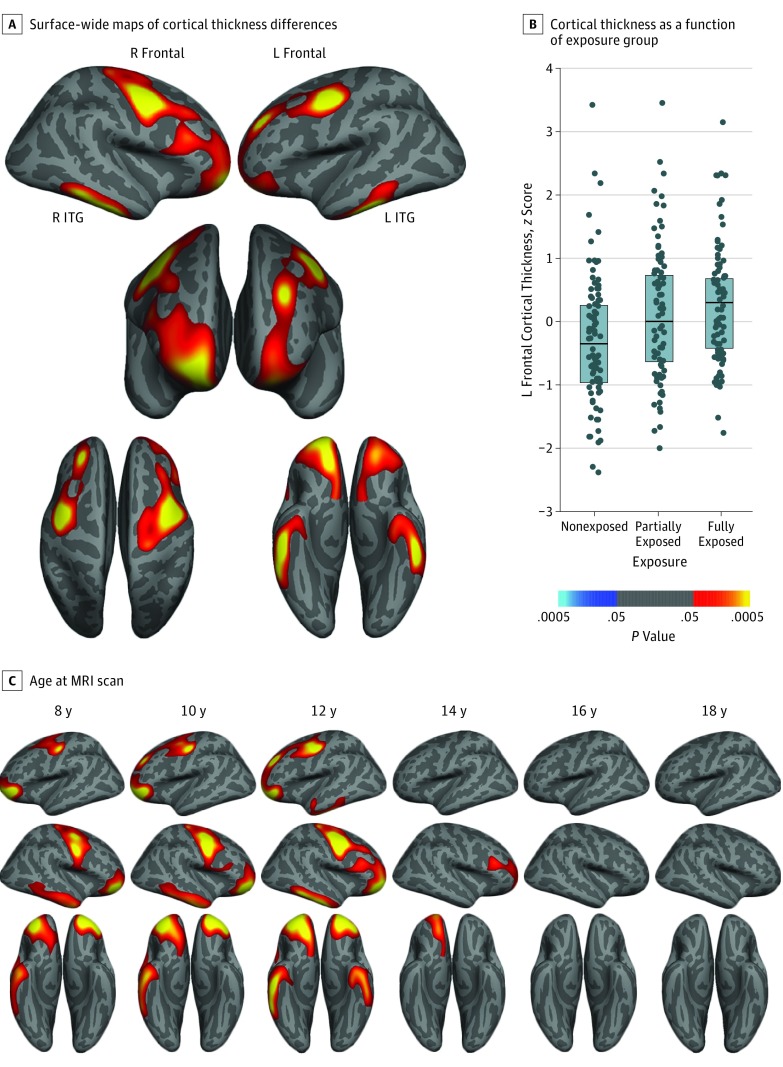
Figure 1. Fortification-Associated Cortical Thickness Changes in the Massachusetts General Hospital Cohort.
A, Surface-wide maps of cortical thickness in fully exposed (n = 99) minus nonexposed (n = 97) individuals reveal higher thickness among youths who were exposed to folic acid fortification during gestation. Images are masked to show only clusters that survive correction for multiple comparisons. B, Dot plots showing cortical thickness in the left frontal cluster as a function of exposure group, suggesting intermediate effects in the partially exposed group. Horizontal lines in the boxes indicate median values, and shaded boxes indicate interquartile ranges. Cortical thickness values are z-transformed residuals after controlling for nuisance covariates. Cool colors (shades of blue) show regions for which cortical thickness is greater in the group that was not exposed to fortification, whereas hot colors (red, orange, and yellow) show regions where cortical thickness is greater in the fully exposed group. C, Age-centered regression analyses indicate clusters with significant between-group differences in thickness as a function of age at magnetic resonance imaging (MRI) scan. This analysis indicates that overall group differences largely reflect exposure-related associations within younger individuals. ITG indicates inferior temporal gyrus; L, left, and R, right.

