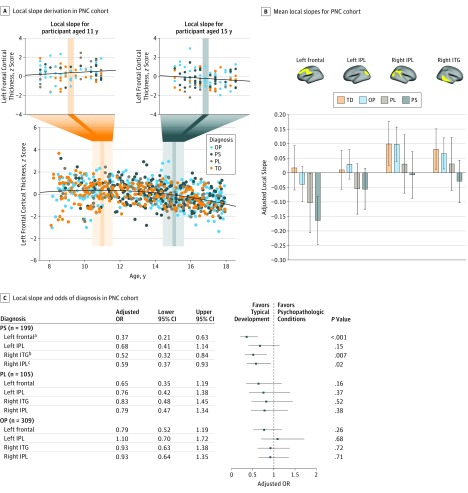
Figure 3. Local Slope Derivation and Association of Delayed Cortical Thinning With Individual Risk for Psychopathologic Conditions in Participants in the Philadelphia Neurodevelopmental Cohort (PNC).
A, In each of the 4 clusters exhibiting delayed cortical thinning in the PNC cohort, local cortical thinning slope was calculated for each individual based on the best-fit line of thickness vs age among all nearby individuals (±6 months). Insets demonstrate local slopes for an 11.0-year-old (left) and a 15.0-year-old (right) participant. B, Mean local slopes for participants in each diagnostic group, in each of the 4 clusters. For example, individuals with psychosis spectrum (PS) symptoms tended to have more negative slopes than those with other diagnoses. Local slopes reflect change in z-transformed cortical thickness scores (adjusted for nuisance covariates) during 1 year. C, Multinomial logistic regression models associated with diagnosis (PS, psychosis low [PL], or other psychopathologic condition [OP] relative to typically developing [TD]; n = 248) of each participant based on local slope, covarying for age, sex, total brain volume, and method of ascertaining diagnosis. Lower adjusted odds ratios indicate reduced odds of psychopathologic condition in the presence of flatter (less negative) local thinning slope, a pattern that was significant for PS in 3 of 4 regions tested. All P values are false discovery rate corrected. All error bars indicate 95% CIs. IPL indicates inferior parietal lobule; ITG, inferior temporal gyrus.
aP < .001.
bP < .01.
cP < .05.

