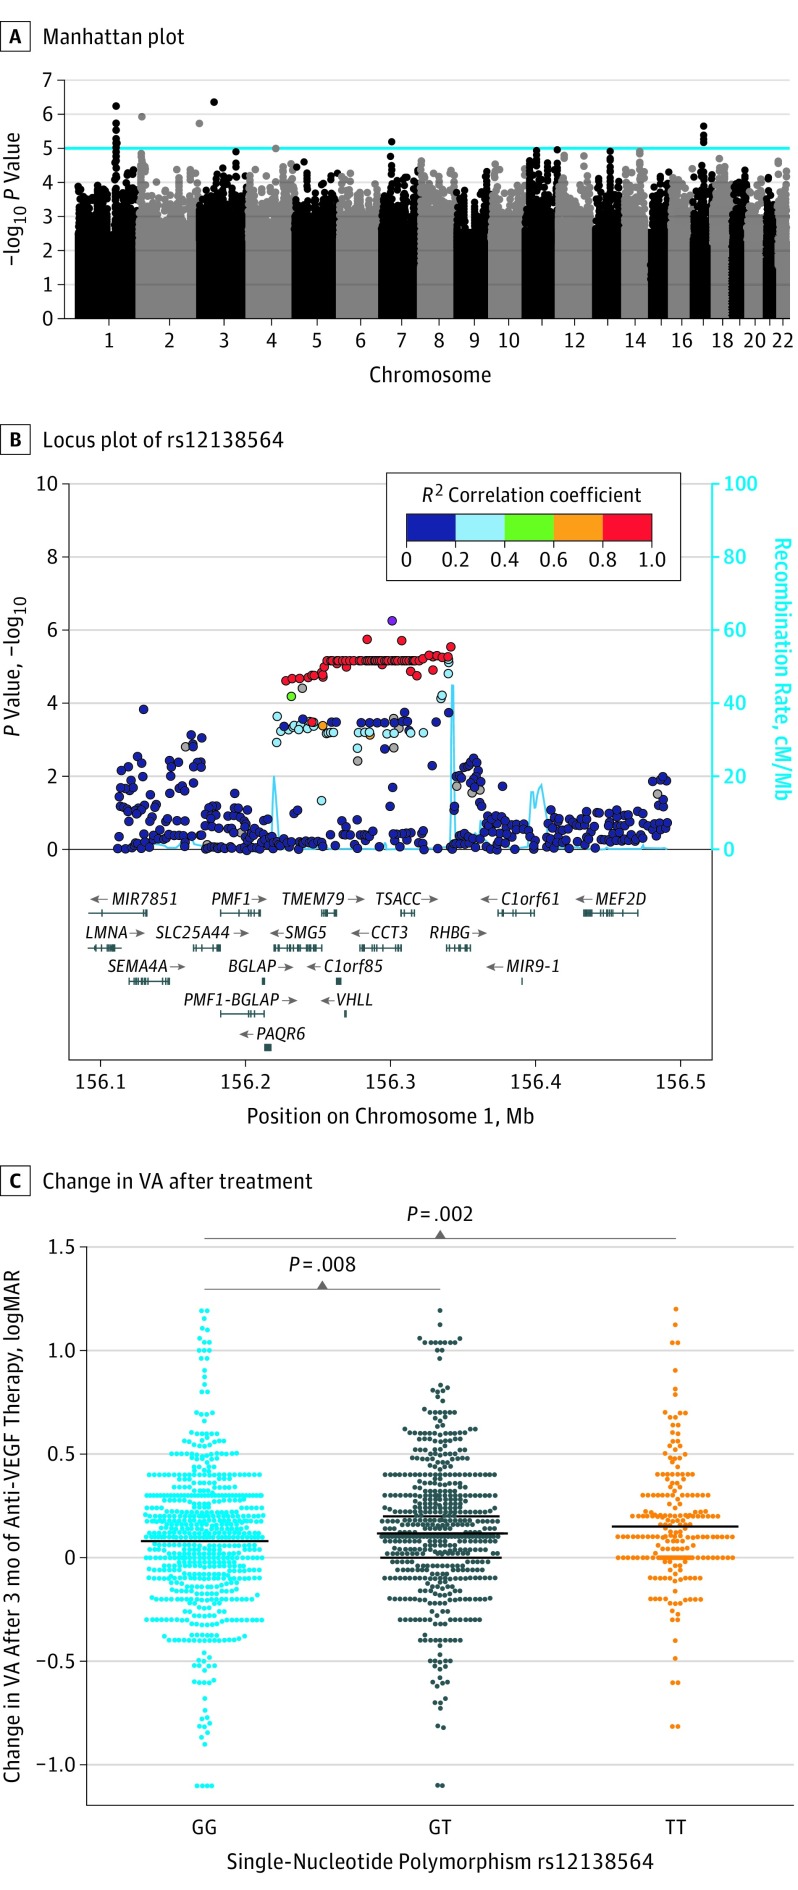
Figure 1. Single-Variant Association Analyses of Common Variants on Response to Anti–Vascular Endothelial Growth Factor (VEGF) Therapy in Neovascular Age-Related Macular Degeneration.
A, Manhattan plot of genome-wide association study for common variants in a discovery cohort (n = 678). The blue line indicates the suggestive significance threshold (P < 5 × 10⁻⁵). B, Locus plot of single-nucleotide polymorphism rs12138564 in the CCT3 gene. The light blue line and right y-axis show the observed recombination rate. C, Visual acuity (VA) change after 3 months of treatment stratified by rs12138564 genotypes in discovery and replication cohorts. The black bars indicate the mean change in VA of the beehive cluster.

