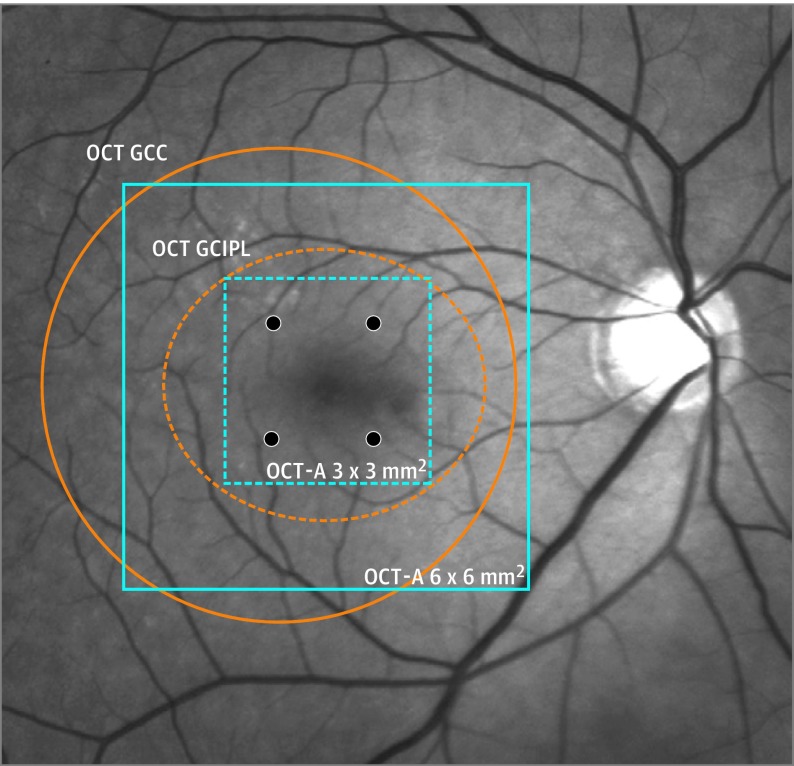
Figure 1. Comparison of the Regions of Interest for Optical Coherence Tomography Angiography (OCT-A) and OCT Measurements Adopted in Clinical Studies.
The OCT-A measurements of vessel density at the macula (3 × 3-mm2 [dashed blue lines]; 6 × 6 mm2 [solid blue lines]) and OCT measurements of ganglion cell complex (GCC) (Optovue Inc) (orange circle) and ganglion cell inner plexiform layer (GCIPL) thicknesses (orange ellipse) (Carl Zeiss Meditec). The 4 visual field locations (24-2) corresponding to the 3 x 3-mm2 central macular region are highlighted in black.

