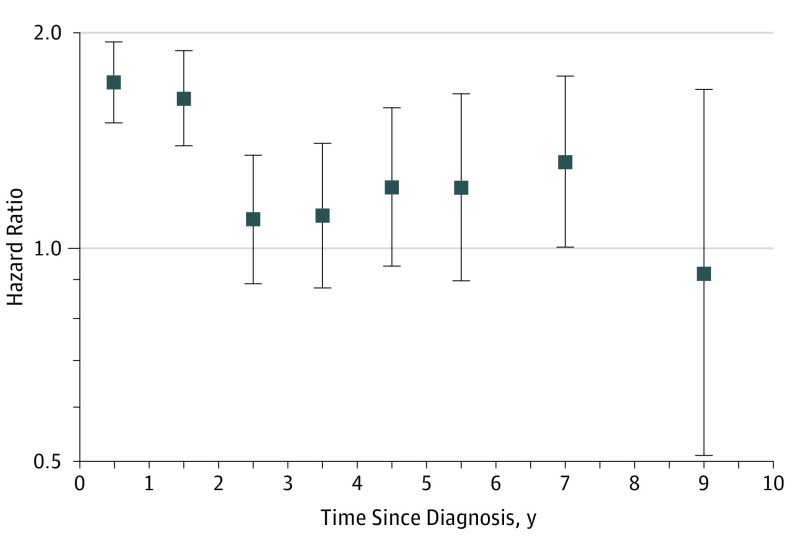
Figure 2. Hazard Ratios for Incident Diabetes Associated With Cancer Development by Time Since Cancer Diagnosis.
Adjusted for age (20-29, 30-39, 40-49, 50-59, and 60-69 years) and sex. Model 2 was further adjusted for body mass index (continuous), smoking (never, former, current, and missing), and frequency of alcohol intake (<1 time per month, 1-2 times per week, 3-4 per week, almost every day, and missing). Model 3 was further adjusted for hypertension (yes or no), hyperlipidemia (yes or no), Charlson comorbidity index (0, 1, 2, ≥3), systolic blood pressure (continuous), fasting glucose (continuous), and total cholesterol (continuous). Error bars indicate 95% confidence intervals.

