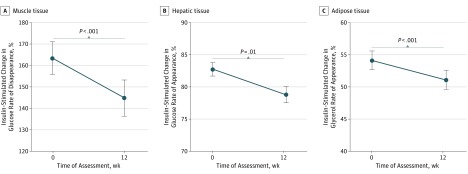
Figure 3. Insulin Sensitivity During Initial Antipsychotic Exposure in the Study Participants.
Data are represented by baseline and 12-week mean values for insulin-stimulated percentage change in glucose rates of disappearance (A) and appearance (B) and glycerol rate of appearance (C) for the total study sample. Error bars indicate SE.

