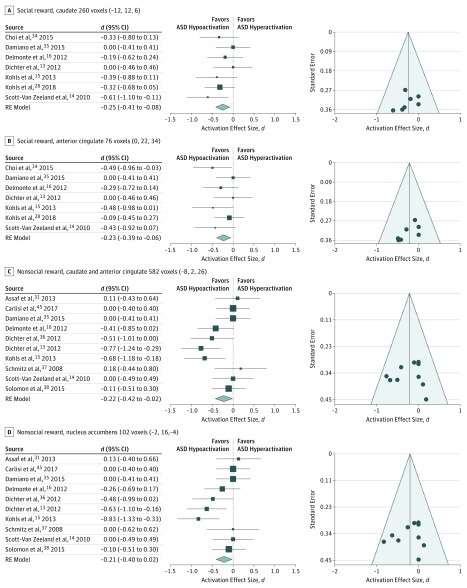
Figure 1. Significant Activation Differences Between Autism Spectrum Disorder (ASD) and Typically Developing Control (TDC) Samples in Response to Social and Nonsocial Stimuli.
Differences in the caudate, nucleus accumbens, and anterior cingulate shown for social (A and B) and nonsocial (C and D) rewards. Forest and funnel plots reflect the average effect size of voxels in the significant meta-analytic cluster. These 4 results were among the most robust; findings replicated in every jackknife sensitivity analysis (eTables 2-4 in the Supplement). Forest plots depict the contribution of each study to the meta-analytic result. Funnel plots show no evidence of publication bias. Voxels not near a reported peak are conservatively estimated as 0 in studies with unavailable maps.13,14,37,38 RE indicates random effects.

