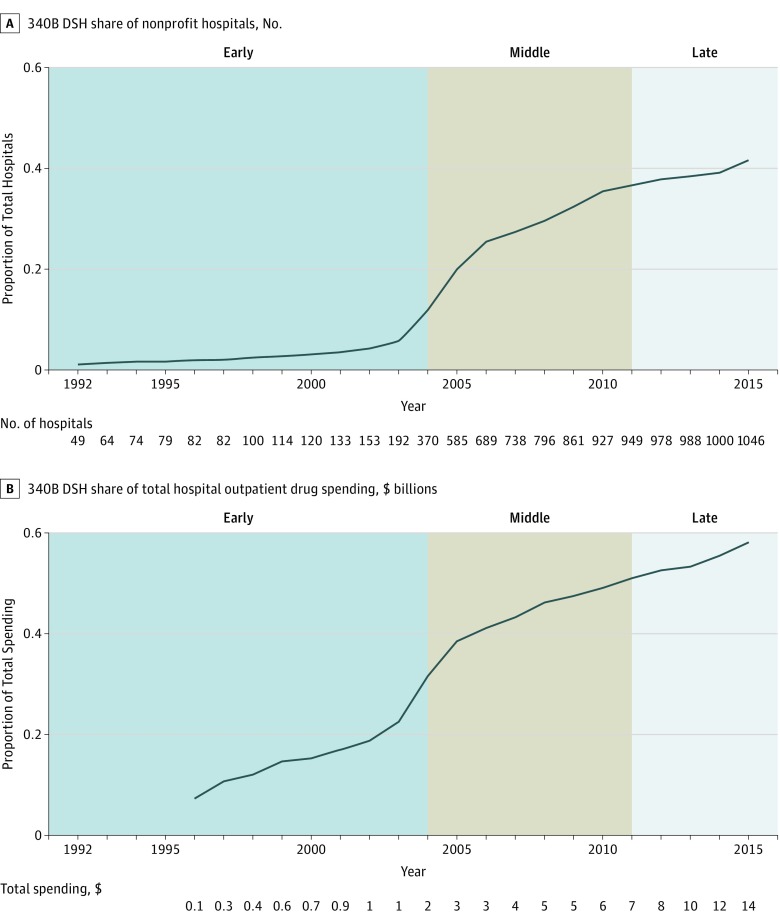
Figure. 340B Participation Among Nonprofit and Public General Acute Care Hospitals.
A, The graph illustrates the share of all nonprofit and public hospitals that are 340B disproportionate-share hospital (DSH) hospitals. B, The graph illustrates the share of all drug spending that originates in 340B institutions. The vertical lines divide the time series into cohorts of participants based on enactment of legislation plausibly affecting hospital finances before 2004 (early); from January 1, 2004, through December 31, 2010 (intermediate); and after the enactment of the Medicare Modernization Act, 2011 or later, and after enactment of the Patient Protection and Affordable Care Act (late). Data are from the 1992-2015 Health Care Cost Report Information System and 340B Office of Pharmacy Affairs 304B provider database (N = 90 930). For both graphs, labeled data are the fraction expressed as a level.

