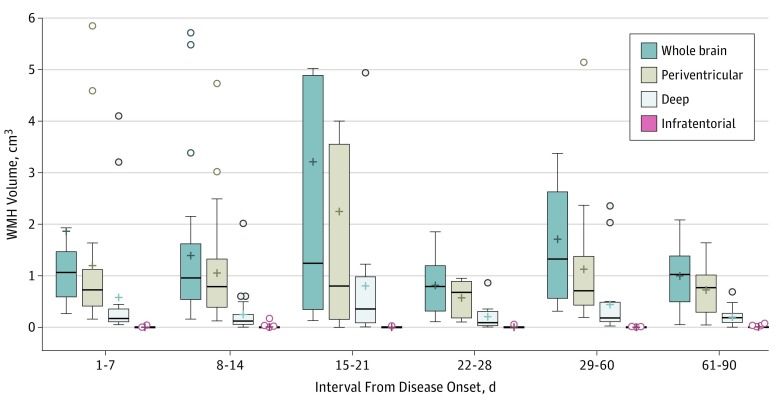
Figure 2. Comparisons of White Matter Hyperintensity Lesion Loads in Different Time Intervals From Disease Onset.
The horizontal lines within the box indicate the median, and the + indicates the mean. The error bars indicate the 1.5 interquartile range of the lower and upper quartiles. The open circle indicates outliers. The following outliers with a volume greater than 6 cm3 are not shown in the figure: day 1-7: whole brain, 8.06 cm3 and 10.35 cm3; day 15-21: whole brain, 16.33 cm3; periventricular, 11.39 cm3; and day 29-60: whole brain, 6.24 cm3.

