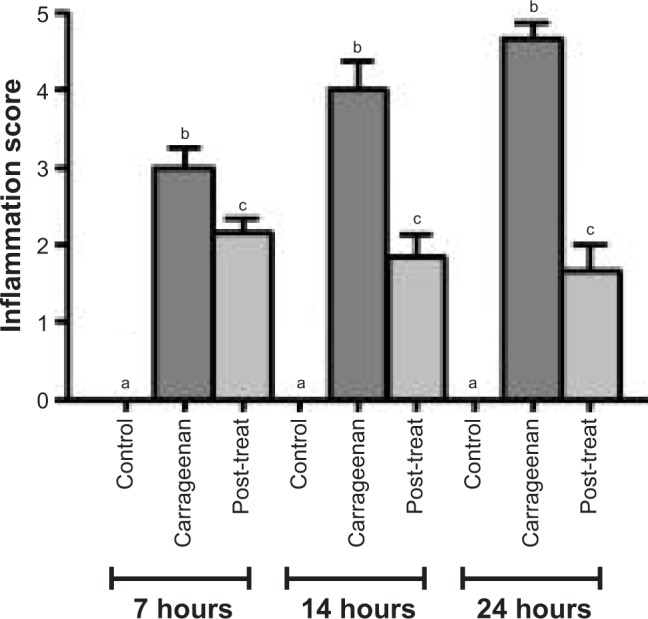
Figure 11.

Statistical analysis of inflammatory scores in H&E-stained paw tissues in control and carrageenan-alone groups as well as post-treated group following triple application of the medicated film.
Notes: Data are mean ± SEM (n=6). Different small letters (a–c) within each time interval indicate significance when P<0.05.
