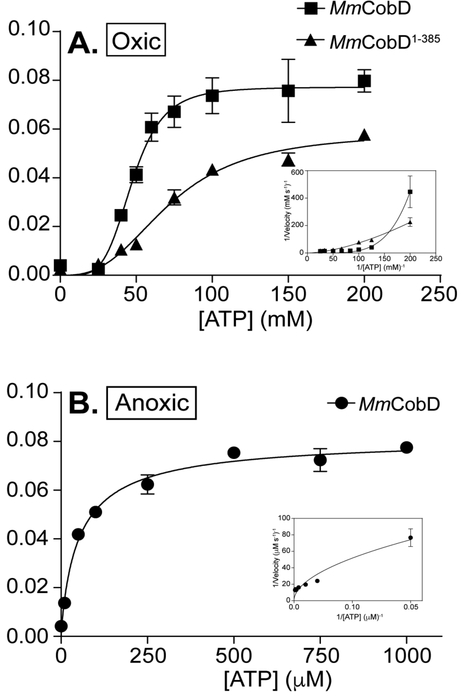
Figure 10.
Kinetic analysis of the ATPase activity. Representative graphs of oxically purified MmCobD (squares) and MmCobD1-385 (triangles) assayed under oxic conditions with the data fit to (A) sigmoidal cooperativity non-linear regression curves. Insets show the double-reciprocal plot. L-Thr concentration was held constant at 50 mM while ATP concentration was varied. Representative graphs of anoxically purified MmCobD (circles) assayed under anoxic conditions with the data fit to (B) Michaelis-Menten non-linear regression curves. Insets show the double-reciprocal plot. L-Thr concentration was held constant at 10 mM while ATP concentration was varied. Assay was performed in duplicate independent experiments with three technical replicates with error bars indicating the standard deviation from the mean. Graphs of initial velocity (μM s−1) vs ATP substrate concentration (mM, for oxic conditions; μM for anoxic conditions) were plotted and pseudo-first-order kinetic parameters were determined using Prism v6 (GraphPad).

