
Figure 8.
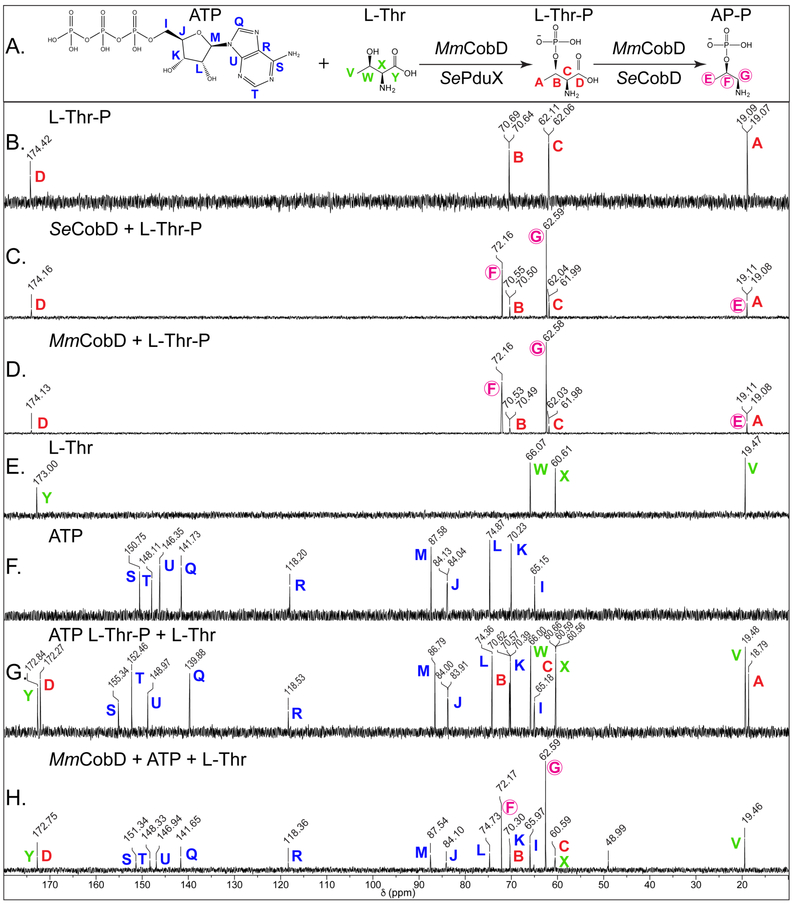
13C-NMR spectra of the reaction catalyzed by MmCobD kinase. Representative 13C-NMR spectra of duplicate independent experiments. Reaction mixtures containing sodium phosphate buffer (5 mM, pH 8.5 at 25°C), MgCl2 (5 mM), ATP (40 mM), L-Thr (40 mM) or L-Thr-P (40 mM), and protein (0.68 μM) were incubated for 1 h at 25°C prior to the addition of D2O (17% v/v). Each panel is labeled with the substrate and or protein reaction mixture. Each peak is labeled with the chemical shift value (ppm) and a color-coded letter corresponding to the carbon atom it represents in the substrates or products, based on the corresponding chemical shifts for the standards in the no-enzyme control reactions. (A) Reactions and chemical structures of substrates with each carbon atom of each reactant or product labeled with a color-coded letter. (B) L-threonine-O-3-phosphate (Thr-P) standard (red). (C) Reaction containing L-Thr-P and Se CobD to generate (R)-1-aminopropan-2-ol O-phosphate (AP-P) standard (circled, fuchsia). (D) Reaction containing L-Thr-P and MmCobD. (E) L-threonine (L-Thr) standard (green). (F) ATP standard (blue). (G) Equimolar mixture of L-Thr, L-Thr-P, and ATP standards. (H) Reaction containing ATP, L-Thr, and MmCobD. Two independent experiments were performed and representative spectra presented. Spectra were processed with MestReNova (Mestrelab Research).