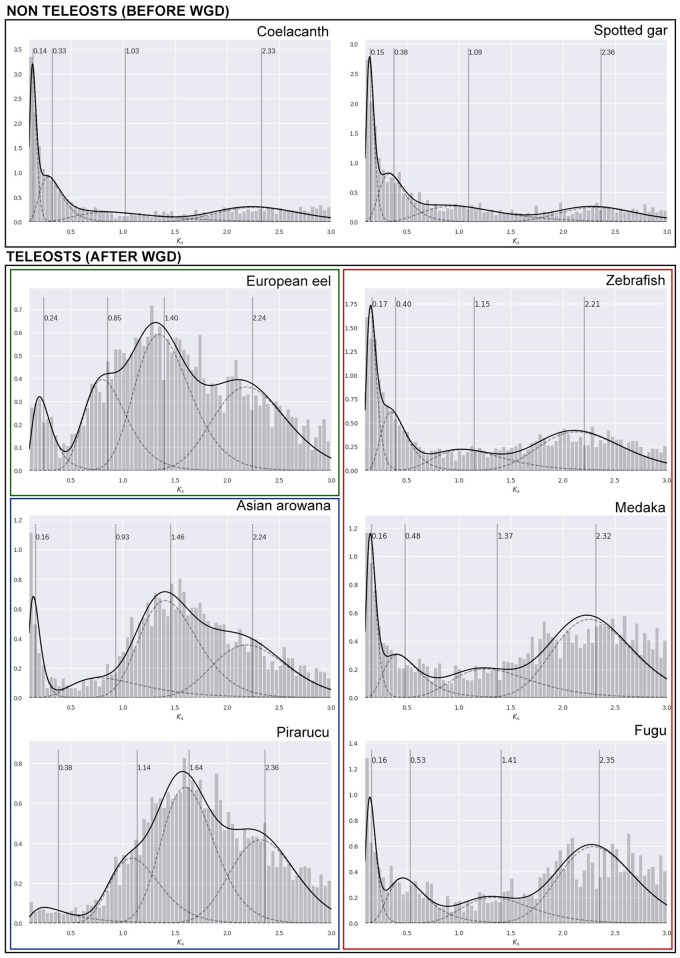
Fig. 3.
—Empirical age distributions. Age distributions based on number of synonymous substitutions per synonymous site (Ks) estimated for paralogous gene families of each species. Distributions were modelled using a four component Gaussian mixture model (GMM). Solid black lines show mixture distributions, and dashed lines represent individual components. Vertical dashed lines correspond to the geometric mean of each component. Ks estimates (X axis) can be interpreted as age divergence between paralogous genes of a given species. The initial peak represents newly duplicated genes (usually derived from small-scale duplication events). Over time, duplications are eventually lost, and a decreasing slope is observed following the initial peak, outlining the steady decrease of retained duplicates. WGD events create distinct peaks to the distribution and can usually be observed as different components in a mixture distribution.

