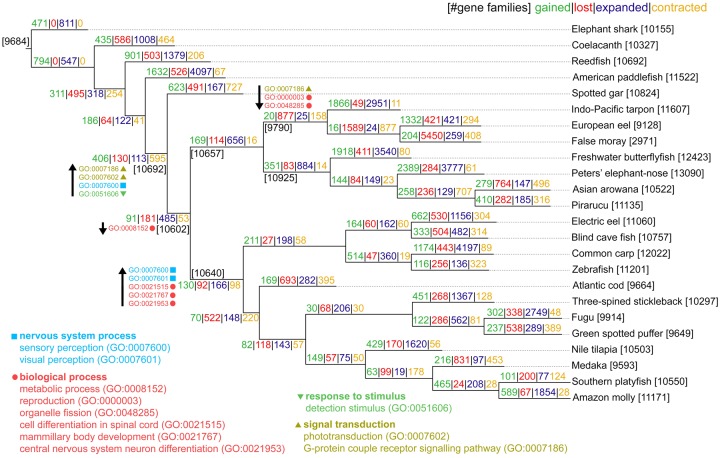
Fig. 4.
—Reconstruction of gene family evolution. Events of gene family gains, losses, expansions, and contractions were inferred with Wagner parsimony. Number of families are indicated in black fonts near nodes. Gains (green numbers) indicate the number of families acquired along lineages leading to their respective MRCA node. Losses (red numbers) indicate lost families along lineages leading to their respective MRCA node. Expansions are indicated by numbers (in blue font) of expanded families (from size 1) and contractions by the number (in yellow font) of contracted families (to size 1) to their respective MRCA node. Gene Ontology (GO) terms associated with changes observed in key points of the phylogeny are shown near each node. GO enrichment was estimated based on Fisher’s exact test (FDR < 0.05) using, as background, population families present in each respective MRCA node. Arrows indicate terms associated to gains and/or expansions (upward) and losses and/or contractions (downward).

