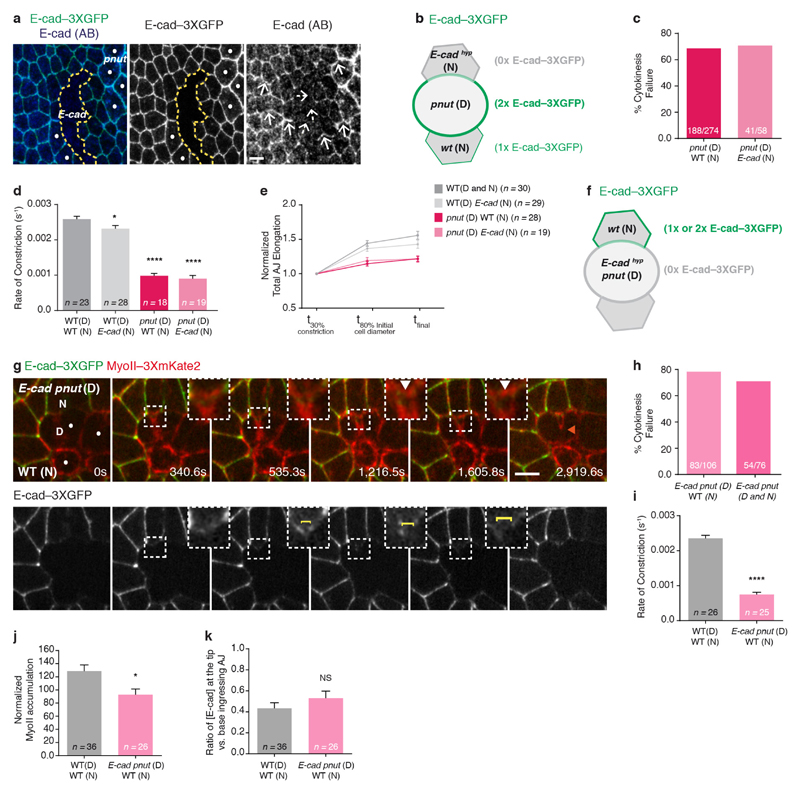
Extended Data Figure 6. Lowering E-cad concentration in cells neighbouring a pnut dividing cell rescues MyoII accumulation.
a, E-cad (dashed outline), wild-type and pnut (dots) cells marked by 0, 1 and 2 copies of E-cad–3 × GFP, respectively. The residual E-cad levels inside the E-cad hypomorphic mutant cells (E-cadhyp) were assessed by antibody staining. White full and dashed arrows denote E-cad staining and decreased staining at the AJ, respectively. n = 79 clones (11 fixed pupae). b, Representation of the experimental setup in Fig. 3i, in which a pnut dividing cell, marked by 2 copies of E-cad–3 × GFP, is facing a wild-type neighbour and an E-cadhyp neighbour, marked by 1 and 0 copies of E-cad–3 × GFP, respectively. c, Percentage of cytokinesis failure of pnut dividing cells facing either wild-type or E-cad neighbours (53 or 35 pupae, respectively). In contrast to previous findings3, our data show that the cytokinesis failure of pnut dividing cells is not rescued by reducing E-cad levels in the neighbours. d, Rate of contractile ring constriction in wild-type and pnut dividing cells facing either wild-type or E-cad neighbours (6, 11, 15 and 15 pupae, respectively). In agreement with c, the rate of constriction is similar in pnut dividing cells facing either wild-type or E-cad neighbours. e, Normalized AJ elongation at the onset of AJ elongation (t30% constriction), at 80% of the initial cell diameter (timing in which MyoII accumulation in the neighbours was measured) and upon full contractile ring constriction (tfinal) of wild-type and pnut dividing cells neighboured by wild-type or E-cad neighbours (6, 11, 15 and 15 pupae, respectively). f, Representation of the experimental setup in g, in which an E-cadhyp pnut double-mutant dividing cell, marked by 0 copies of E-cad–3 × GFP, is facing a wild-type neighbour, marked by E-cad–3 × GFP. g, MyoII–3 × mKate2 distribution in a wild-type neighbouring cell, marked by E-cad–3 × GFP expression, facing an E-cad pnut double-mutant dividing cell (dots), marked by the absence of E-cad–3 × GFP. White arrowheads denote MyoII–3 × mKate2 accumulation in the neighbour. Yellow brackets indicate reduced E-cad–3 × GFP signal at the ingressing AJ. Orange arrowhead indicates cytokinesis failure, evident by the detachment of the midbody from the dividing cell membranes. n = 26 cells (10 pupae). h, Percentage of cytokinesis failure of E-cad pnut double-mutant dividing cells facing wild-type or E-cad pnut neighbours (11 or 10 pupae, respectively). These findings further support that the cytokinesis defects observed in pnut mutant cells (c) are intrinsic to the dividing cell. i, Rate of contractile ring constriction in wild-type or E-cad pnut double-mutant dividing cells facing wild-type neighbours (6 or 10 pupae, respectively). j, Normalized MyoII accumulation at 80% of the initial cell diameter in wild-type cells neighbouring wild-type or E-cad pnut double-mutant dividing cells (6 or 10 pupae, respectively). k, Ratio of E-cad–3 × GFP intensity at the tip versus the base of the ingressing AJ in wild-type cells neighbouring wild-type or E-cad pnut double-mutant dividing cells (6 or 10 pupae, respectively). n denotes number of cells throughout. n/n indicates the number of cells that failed cytokinesis/total number of cells. *P < 0.05, ****P < 0.0001, ANOVA (d) or Mann–Whitney U-test (i–k). Data are mean ± s.e.m. Scale bars, 5 μm.

