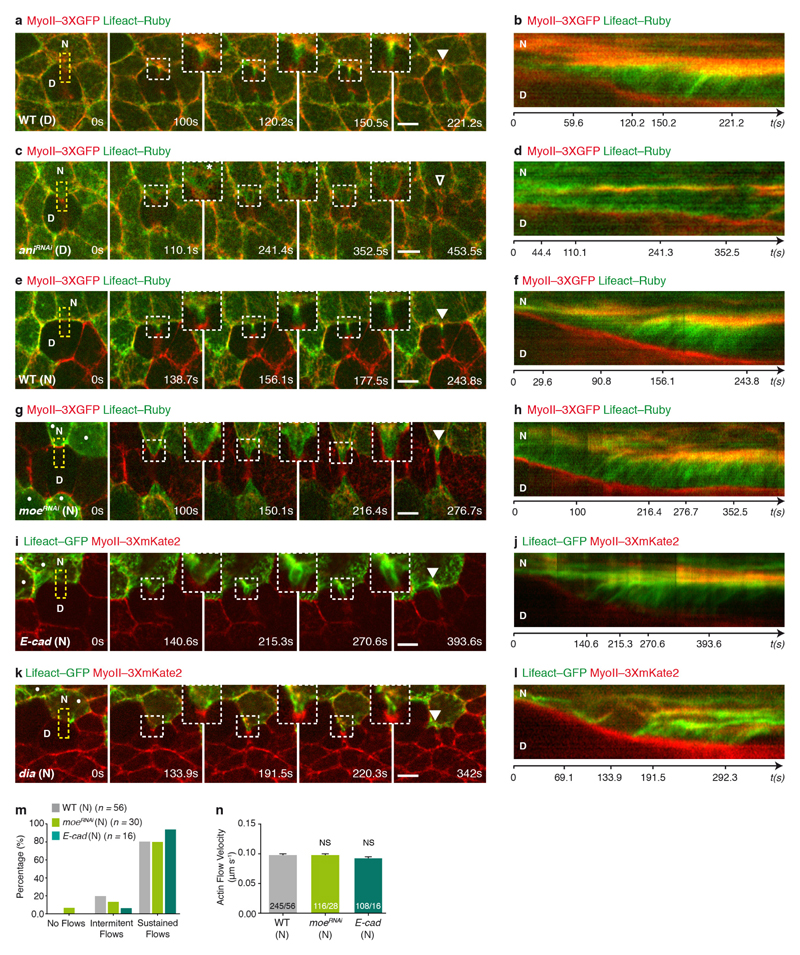
Extended Data Figure 10. Actomyosin flows in wild-type and ani, moe, E-cad and dia mutant conditions.
a–d, Wild-type (a, b; n = 25 cells, 4 pupae) or aniRNAi (c, d; n = 46 cells, 8 pupae) dividing and neighbouring cells expressing Lifeact–Ruby in a MyoII–3 × GFP tissue. Kymographs in b and d along the yellow boxes in a and c, respectively. Insets and respective kymograph in (a, b) highlight progressive accumulation of MyoII–3 × GFP and Lifeact–Ruby in the neighbours cells, via actomyosin flows, while in (c, d) it denotes a reduction in the actomyosin flows observed in cells neighbouring an aniRNAi dividing cell, as well as the diminished accumulation of MyoII–3 × GFP and Lifeact–Ruby at the base of the ingressing AJ (see Fig. 1d, e, Supplementary Video 2b and Fig. 4k, l). Note that in c and d, all cells express aniRNAi cells, marked by Lifeact–Ruby. To visualize F-actin dynamics exclusively in the neighbours in a–d, we photobleached the dividing cell before contractile ring constriction. e–h, Lifeact–Ruby-expressing wild-type (e, f; n = 27 cells, 5 pupae) or moeRNAi (g, h; n = 30 cells, 10 pupae) cells neighbouring a wild-type dividing cell in a MyoII–3 × GFP tissue. Kymographs in f and h along the yellow boxes in e and g, respectively. Insets and kymographs highlight the progressive accumulation of MyoII–3 × GFP and Lifeact–Ruby in both the wild-type and moeRNAi neighbours, via actomyosin flows. Dots denote moeRNAi cells, marked by Lifeact–Ruby. In agreement with our observation that MyoII accumulation occurs in moeRNAi neighbouring cells (Extended Data Fig. 3h and Supplementary Videos 4c, d), the F-actin flows are similar in velocity and amount to those observed in wild-type neighbouring cells (see m, n). i–l, E-cad (i, j, n = 16 cells, 5 pupae) or dia (k, l, n = 19 cells, 3 pupae) cells, marked by Lifeact–GFP, neighbouring a wild-type dividing cell in a MyoII–3 × mKate2 tissue. Dots denote E-cad (i) or dia (k) mutant cells. Kymographs in j and l generated along the yellow boxes in i and k, respectively. E-cad neighbours accumulate actomyosin at the base of the ingressing AJ (see Fig. 3j) and exhibit actomyosin flows similar to wild-type neighbours (see m and n). By contrast, dia neighbours exhibit delayed accumulation of MyoII (Extended Data Fig. 7i, j). Accordingly, in this context the F-actin flows are slower than in wild-type neighbours (see Fig. 4o, p). m, Percentage of wild-type, moeRNAi and E-cad neighbouring cells (12, 10, 5 pupae, respectively) exhibiting no flows, intermittent flows (< 3 detectable speckles), or sustained flows (≥ 3 detectable speckles) when facing wild-type dividing cells. n, Actin flow velocity for wild-type, moeRNAi and E-cad neighbours facing wild-type dividing cells. n/n indicates number of speckles/number of cells (12, 9 and 5 pupae, respectively). Kruskal–Wallis test. Scale bars, 5 μm.

