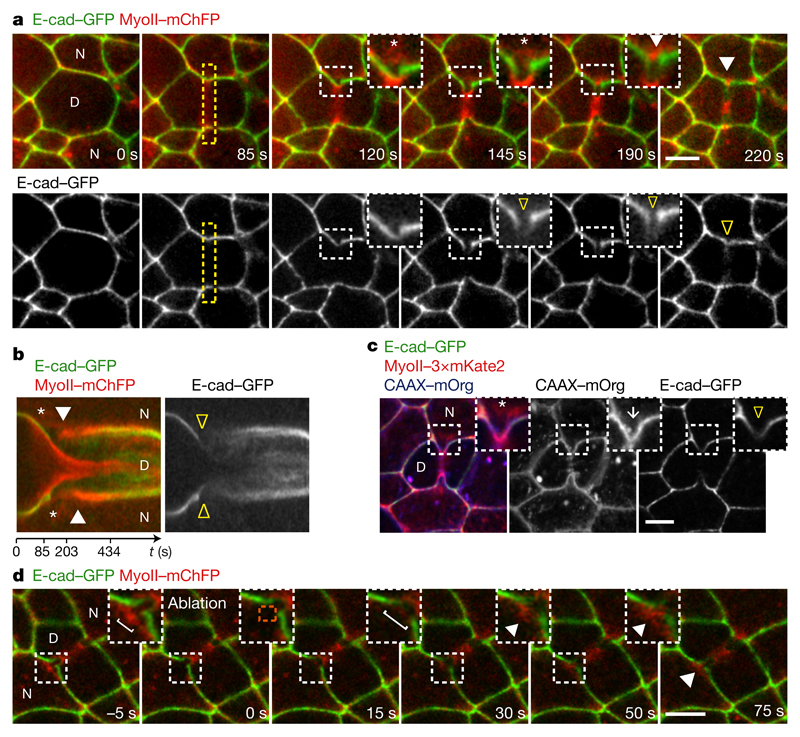
Figure 2. Cortex detachment and E-cad decrease precede MyoII accumulation.
a, b, E-cad–GFP and MyoII–mChFP during cytokinesis. Kymograph in b along the yellow box. Asterisks denote MyoII–mChFP and E-cad–GFP signal separation. Yellow open arrowheads indicate reduced E-cad–GFP at the ingressing AJ; white arrowheads denote MyoII–mChFP accumulation in neighbours. n = 23 cells (4 pupae). c, E-cad–GFP, MyoII–3 × mKate2 and CAAX–mOrg upon ring constriction. White arrow denotes AJ ingression; asterisk and arrowhead as in a, b. n = 42 cells (8 pupae). d, Laser ablation of detached cortical MyoII (t = 0 s, ablated region: orange box). Brackets denote ingressed AJ width, indicating neighbour relaxation upon ablation. White arrowheads indicate MyoII–mChFP re-accumulation upon ablation. n = 24 ablations (3 pupae). Scale bars, 5 μm.

