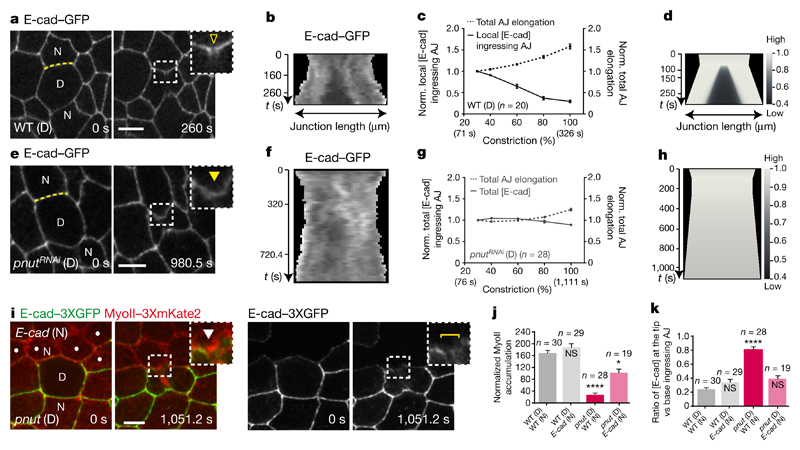
Figure 3. Lowering E-cad concentration at the ingressing AJ promotes MyoII accumulation.
a, b, e, f, E-cad–GFP in wild-type (a, b, n = 20 cells, 5 pupae) or pnutRNAi (e, f, n = 28 cells, 6 pupae) cells. Kymographs in b and f along the yellow lines in a and e, respectively (see Methods). Yellow open arrowhead denotes reduced E-cad–GFP at the ingressing AJ; yellow filled arrowhead indicates absence of a notable E-cad–GFP decrease. All cells in e are pnutRNAi, marked by lack of cytosolic GFP. c, g, Normalized local (c) or total (g) E-cad–GFP intensity at the ingressing AJ (solid line), and normalized total AJ elongation (dashed lines) versus ring constriction, respectively in wild-type (c) or pnutRNAi (g) dividing cells (5 or 6 pupae, respectively). d, h, Numerical integration of E-cad levels on a locally or globally elongating AJ, as measured in wild-type (d) or pnutRNAi (h) dividing cells. i, MyoII–3 × mKate2 in a pnut dividing cell (marked by two E-cad–3 × GFP copies) and its E-cad mutant neighbour (dots, marked by lack of E-cad–3 × GFP). Brackets denote E-cad–3 × GFP transient reduction at ingressing AJ. White arrowheads indicate MyoII–3 × mKate2 accumulation in neighbours. n = 19 cells (15 pupae). j, Normalized MyoII accumulation at 80% of the initial cell diameter in wild-type or E-cad mutant cells neighbouring wild-type or pnut dividing cells (6, 11, 15 and 15 pupae, respectively). k, E-cad–3 × GFP intensity ratio at the tip versus the base of ingressing AJ in wild-type or E-cad mutant cells neighbouring wild-type or pnut dividing cells (6, 11, 15 and 15 pupae, respectively). n indicates cell number throughout. NS, not significant. *P < 0.05, ****P < 0.0001, Kruskal–Wallis test. Data are mean ± s.e.m. Scale bars, 5 μm.

