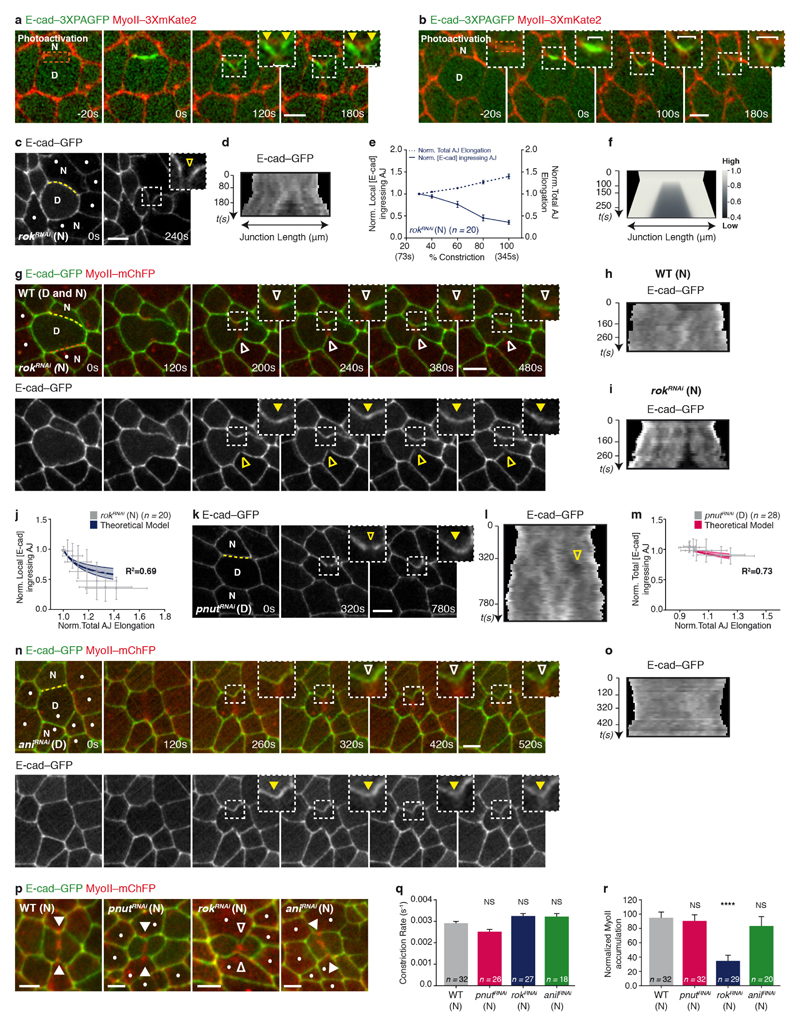
Extended Data Figure 5. Local AJ elongation is sufficient to trigger a decrease of E-cad concentration at the ingressing AJ.
a, b, Photoactivation of E-cad–3 × PAGFP at the AJ shared between the dividing cell and its neighbour (a; n = 19 cells, 5 pupae) or at the tip of the ingressing AJ (b; n = 25 cells, 6 pupae) in a MyoII–3 × mKate2 tissue (t = 0 s, orange boxes denote photoactivated regions). White brackets indicate reduction of photoactivated E-cad–3 × PAGFP signal at the ingressing AJ. Yellow filled arrowheads indicate that at the base of the ingressing AJ, the photoactivated E-cad–3 × PAGFP signal remains high. c, d, E-cad–GFP distribution in the dividing cell and its rokRNAi neighbours (dots, marked by the absence of cytosolic GFP). Kymograph in d along the yellow box. Yellow open arrowheads denote reduced E-cad–GFP signal at the ingressing AJ. n = 20 cells (7 pupae). e, Normalized local E-cad intensity at ingressing AJ (solid line), and normalized total AJ elongation (dashed line) versus the amount of constriction in wild-type dividing cells facing rokRNAi neighbours (7 pupae). f, Numerical integration of E-cad levels on a locally elongating AJ, as measured in wild-type dividing cells facing rokRNAi neighbours. g–i, E-cad–GFP and MyoII–mChFP distribution in a wild-type dividing cell facing a rokRNAi and a wild-type neighbour. Kymographs in h and i generated along the yellow and orange lines, respectively. White open arrowheads denote reduced MyoII–mChFP accumulation in the neighbours; yellow filled arrowheads denote absence of E-cad–GFP decrease at the ingressing AJ; yellow open arrowheads denote decrease of E-cad–GFP at the ingressing AJ. In 15% of cases (n = 20, 7 pupae), the contractile ring is positioned off-centre. In these cases, junction elongation on the wild-type side is small and no decrease in E-cad is observed (h). Furthermore, MyoII does not accumulate in this wild-type neighbour. As shown above, in the rokRNAi side, the junction elongates and E-cad decreases (c–f, i). This further argues that junction elongation is an important factor in the local decrease in E-cad signal. j, m, Normalized local (j) or total E-cad–GFP (m) intensity at the ingressing AJ versus the normalized total AJ elongation in wild-type dividing cells facing rokRNAi neighbours (j; 7 pupae), or pnutRNAi dividing cells (m; 6 pupae) and the corresponding theoretical integrations, respectively (line corresponds to the best-fit parameters measured by E-cad–GFP FRAP, shaded regions correspond to 1 s.d. confidence interval). The coefficient of determination and s.d. of the residuals are respectively R2 = 0.69, S = 0.14 (j) and R2 = 0.73, S = 0.03 (m). k, l, E-cad–GFP distribution in a pnutRNAi dividing cell and its neighbours. Kymograph in l along the yellow line. Yellow arrowheads as in g. In 14 out of the 28 cells analysed (6 pupae), cells neighbouring pnutRNAi dividing cells show a transient decrease in E-cad–GFP levels at the ingressing AJ. In all cases, these reductions in E-cad levels occur during earlier stages of contractile ring constriction. All cells shown express pnutRNAi, marked by the absence of cytosolic GFP. n, o, E-cad–GFP and MyoII–mChFP distribution in an aniRNAi dividing cell and its neighbours (dots, marked by absence of cytosolic GFP). Kymograph in o generated along the yellow line. Arrowheads as in g. aniRNAi dividing cells exert lower pulling forces (see Fig. 1e and Extended Data Fig. 1m–o) on the neighbour membranes during constriction and induce a less pronounced decrease in E-cad signal along the ingressing AJ. Note that in comparison to the upper junction, the lower junction exhibits a partial reduction of E-cad levels. Accordingly, a small MyoII accumulation can be observed. n = 17 cells (3 pupae). p, E-cad–GFP and MyoII–mChFP localization in wild-type (n = 32 cells, 5 pupae), pnutRNAi (n = 32 cells, 4 pupae), rokRNAi (n = 29 cells, 11 pupae) and aniRNAi (n = 20 cells, 4 pupae) neighbours facing a wild-type dividing cell. Dots denote pnutRNAi, rokRNAi and aniRNAi cells, marked by the absence of cytosolic GFP. White filled and open arrowheads indicate MyoII–mChFP accumulation and reduced accumulation in the neighbours, respectively. Note that the phenotype of rokRNAi neighbouring cells is specific, as pnutRNAi and aniRNAi neighbours facing a wild-type dividing cell still accumulate MyoII similarly to wild-type neighbours (see r). q, Rate of contractile ring constriction in wild-type dividing cells facing wild-type, pnutRNAi, rokRNAi and aniRNAi neighbours (5, 4, 11 and 4, respectively). Although Rok abrogates MyoII accumulation in the neighbours, it doesn’t affect the rate of constriction in the dividing cell (see r). r, Normalized MyoII accumulation at 80% of the initial cell diameter in wild-type, pnutRNAi, rokRNAi and aniRNAi neighbours (5, 4, 11 and 4 pupae, respectively) facing wild-type dividing cells. n denotes number of cells throughout. ****P < 0.0001, Kruskal–Wallis test. Data are mean ± s.e.m. (e, q, r) or ± s.d. (j, m). Scale bars, 5 μm.

