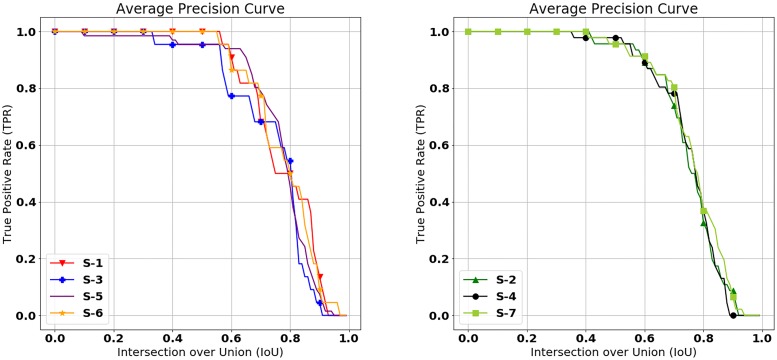
Fig 3. True positive rate as a function of the minimum IoU value.
The left figure shows the average precision curves of S-1, S-3, S-5, and S-6 which are results of setups tested on INbreast and the right figure shows the average precision curves of S-2, S-4, and S-6 which are the results of setups tested on GURO.

