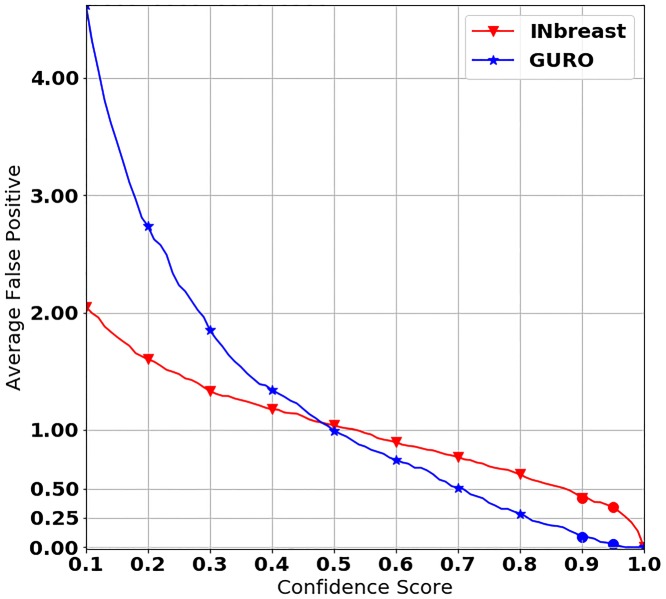
Fig 5. X of the curve is the average number of false positives per image, and Y of the curve is the confidence score of our mass detection model.
To show how well our mass detection model works on mammograms without masses, we trained our model on the mammograms containing masses and tested it on the mammograms without masses. The red line denotes the result on INbreast and the blue line denotes the result on GURO. To make it easier to distinguish between similar values, we converted the scale to a log scale, and the confidence score starts at 0.1.

