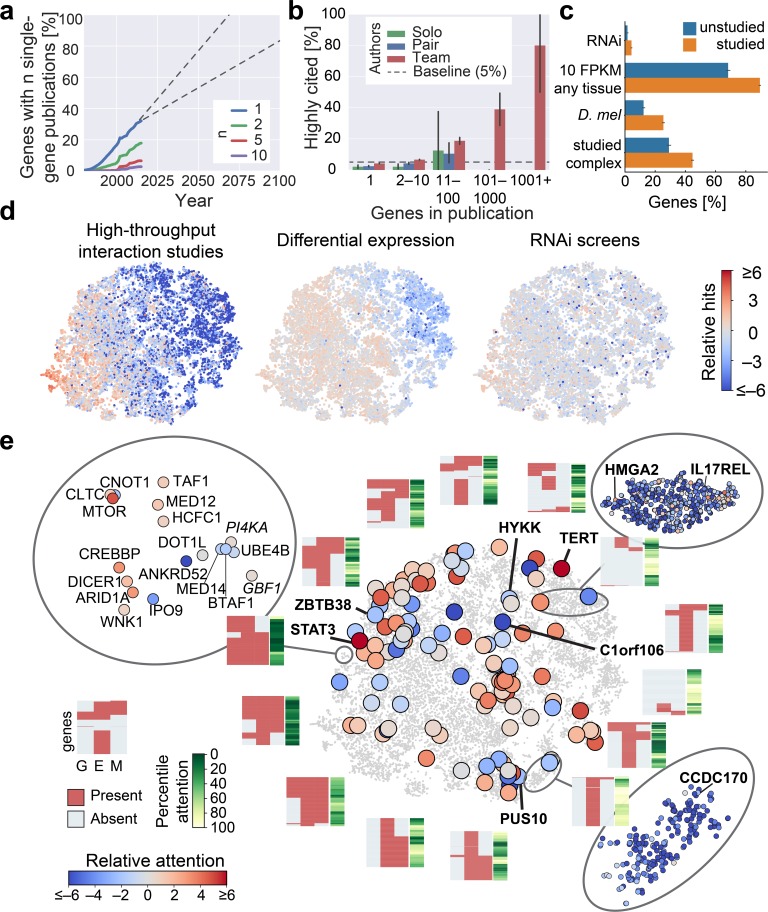
Fig 4. Identifying and exploring ignored genes.
(A) Estimation of the years until all genes are studied if scientific enterprise continues to follow trends reported above. Number of genes with at least n focused (single-gene) publications per year. Dashed lines show extrapolation of the bounds of linear regression for recent years. (B) Percentage of highly cited studies (top 5% in number of citations) in the 8 years following their publication. Error bars show 95% confidence intervals. (C) Percentage of genes with a strong RNAi phenotype, at least one tissue with moderate RNA abundance, presence of a Drosophila melanogaster homolog, or membership in a complex with highly studied genes. Highly studied genes show higher percentages for all these characteristics, but many unstudied genes also share those characteristics. (D) Illustration of bias in identification of hits in distinct large-scale experimental approaches. Interaction studies refer to studies labelled as “High throughput” within BioGRID. Relative hits marks fold enrichment over equal occurrence (S1 Data). (E) Genes grouped by t-SNE visualization using the 15 features most important to the models used in Fig 1A. Large circles highlight genes with frequently discovered GWAS traits. Heatmaps show presence of strong genetic evidence (G), experimental potential (E), and homolog in invertebrate model organism (M). Note the lack of a strong correlation between GEM characteristics and research attention. E, experimental potential; FPKM, fragments per kilobase of transcript per million mapped reads; G, strong genetic support; GEM, strong genetic support and experimental potential and homolog in invertebrate model organism; GWAS, genome-wide association study; M, model organism; RNAi, RNA interference; t-SNE, t-distributed stochastic neighbor embedding.

