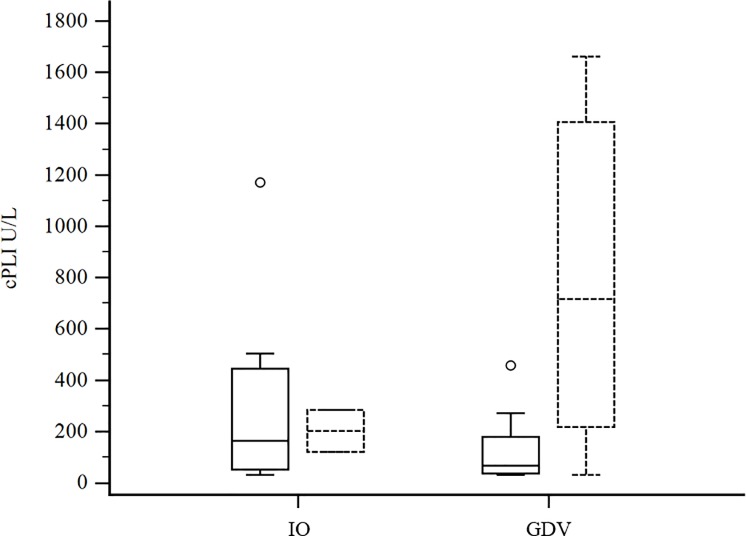
Fig 1. Box-and-whiskers plot of cPLI concentration (μg/L) at T0 in dogs with IO (n = 16) and GDV (n = 22).
Boxes with solid lines represent survivors, while dotted lines represent non-survivors. For each box, the horizontal line represents the median value, and the upper and lower boundaries represent the 75th and 25th percentiles, respectively. Whiskers represent the minimum and maximum; circles represent outlier values.

