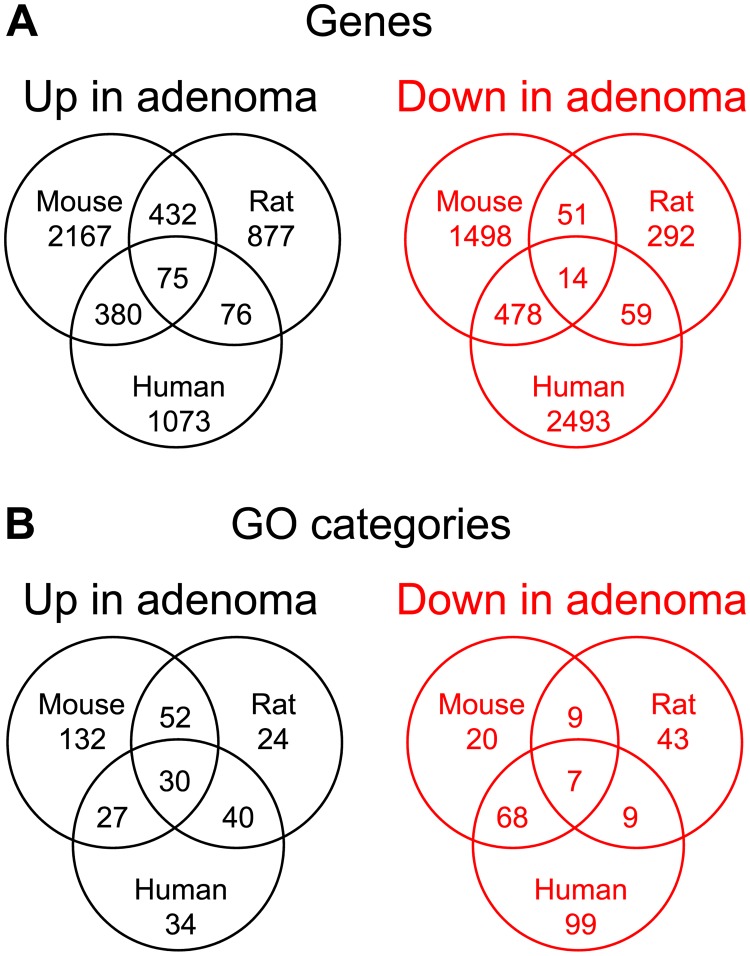
Fig 1. Venn diagram of genes whose transcript levels differ between colonic adenoma and normal epithelium for three genera.
The sets of genes with differential transcript levels between colonic adenomas and normal colonic epithelium are summarized for the untreated Apc Min/+ mouse, Apc Pirc/+ rat, and human. Up in adenoma presents genes with increased levels in adenomas compared to the normal colonic epithelium. Down in adenoma presents genes with decreased levels in adenomas. The mouse and rat data were collected from experiments described in Methods and accessible in GEO datasets GSE107139 and GSE54036. Human data were retrieved from the published GEO dataset GDS2947 comparing adenomatous tumors with normal colonic tissue from 32 patients with spontaneous, non-familial colorectal cancer. For each genus, the comparison of transcript level was performed using a stringency of a change in transcript level by at least a factor of 2 with a false discovery rate of 0.05. The pairwise and three-way intersections for these sets were determined from this Venn diagram. The Venn diagram in Panel A displays the pairwise and three-way intersections of these gene lists between genera. For each differential gene list, the corresponding set of enriched GO categories was determined using a multi-set approach that accounts for category size variation and category overlaps. The Venn diagram in Panel B displays the pairwise and three-way intersections between genera of these lists of enriched GO categories. The higher agreement between genera at the GO level, suggested by these Venn diagrams, was tested by permutation analysis in Fig 2.

