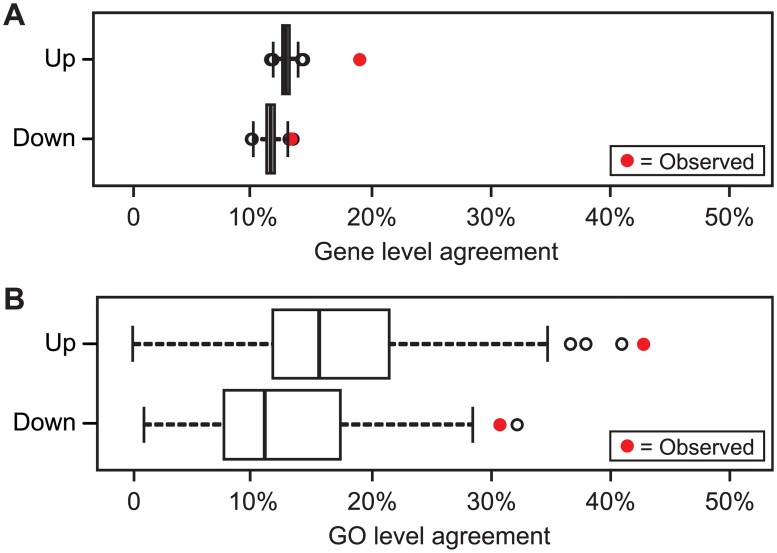
Fig 2. Permutation test of significance of agreement between differential transcriptome signals shared by all three genera.
Each panel compares the observed mean pairwise overlap fraction (red) of the three species lists with the distribution of sharing rates for randomized data (boxplot, from 1000 gene-permutations). The extent of sharing among gene lists (Panel A) is lower than the GO level (19% and 13%, for up and down, respectively), but still higher than expected by chance. On a GO basis (Panel B), the observed intersection between genera for enhanced signals is 43% (p = 0.001) and for diminished signals 33% (p = 0.002). Though relatively few adenoma-associated transcripts are shared among all three genera, the agreement is statistically significant and is accentuated at the level of GO functional categories.

